
What Are Graphs?
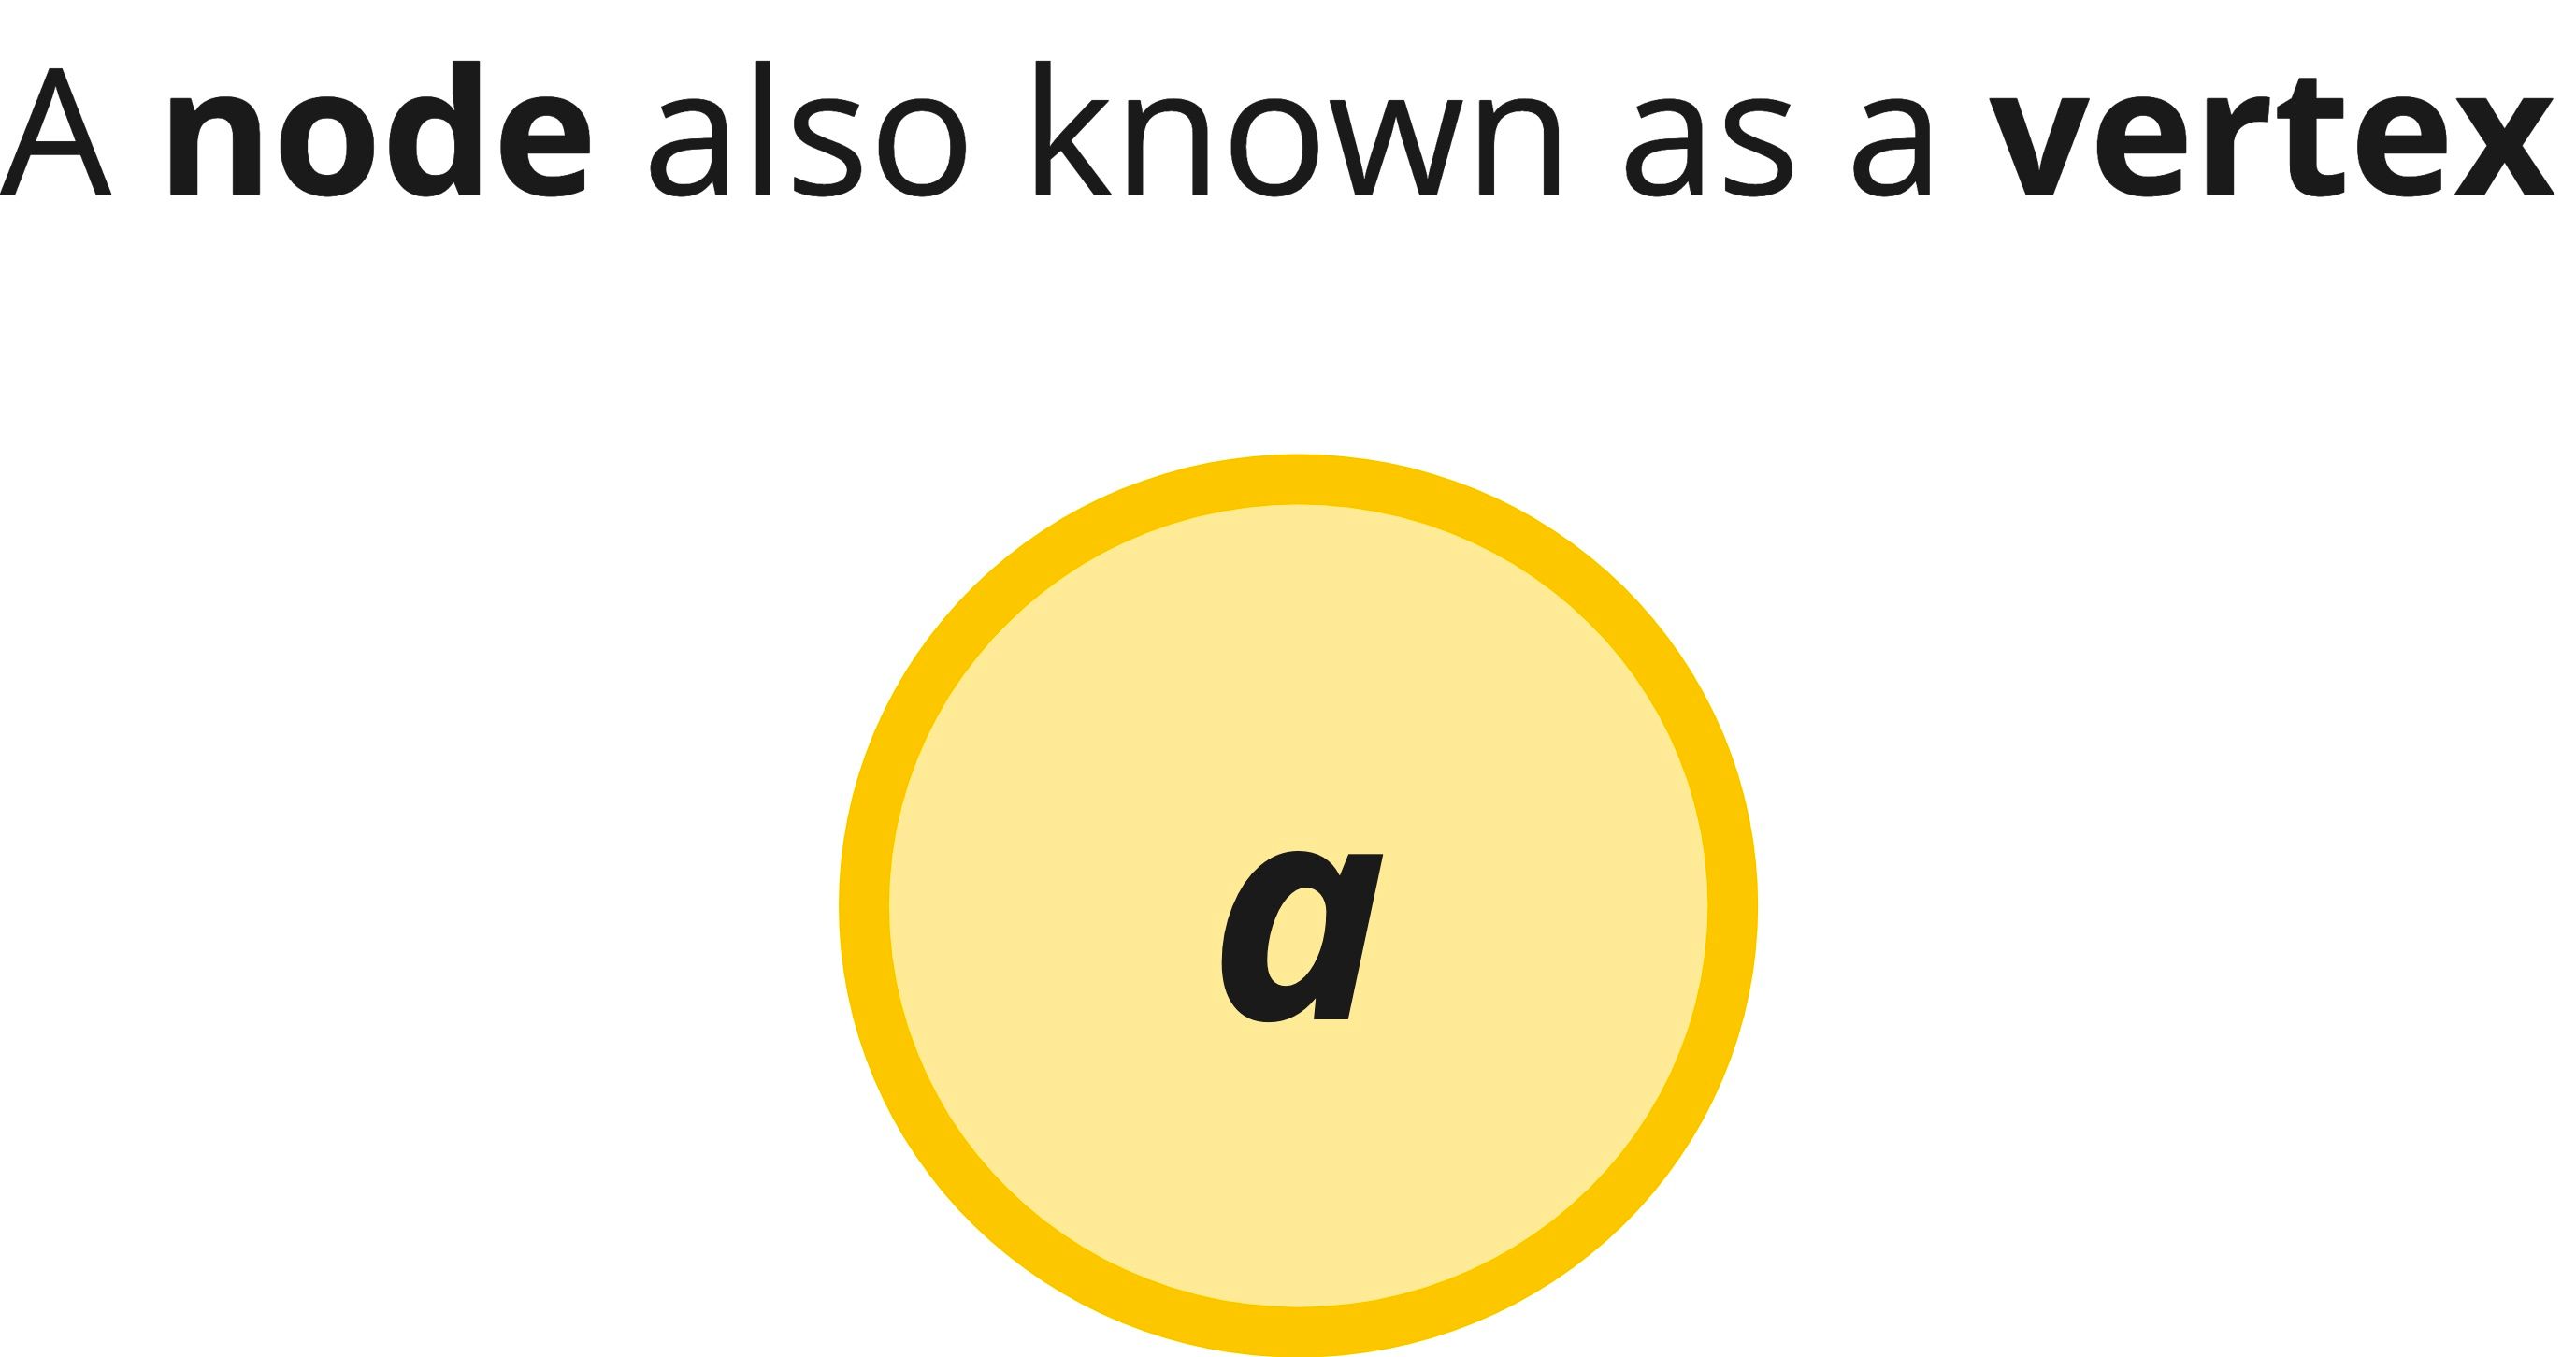
Graphs are a powerful and flexible data structure in computer science, comprising nodes (also known as vertices), and edges that establish connections between these nodes. This structure can represent any binary relationship, making it highly versatile and adaptable to various contexts.
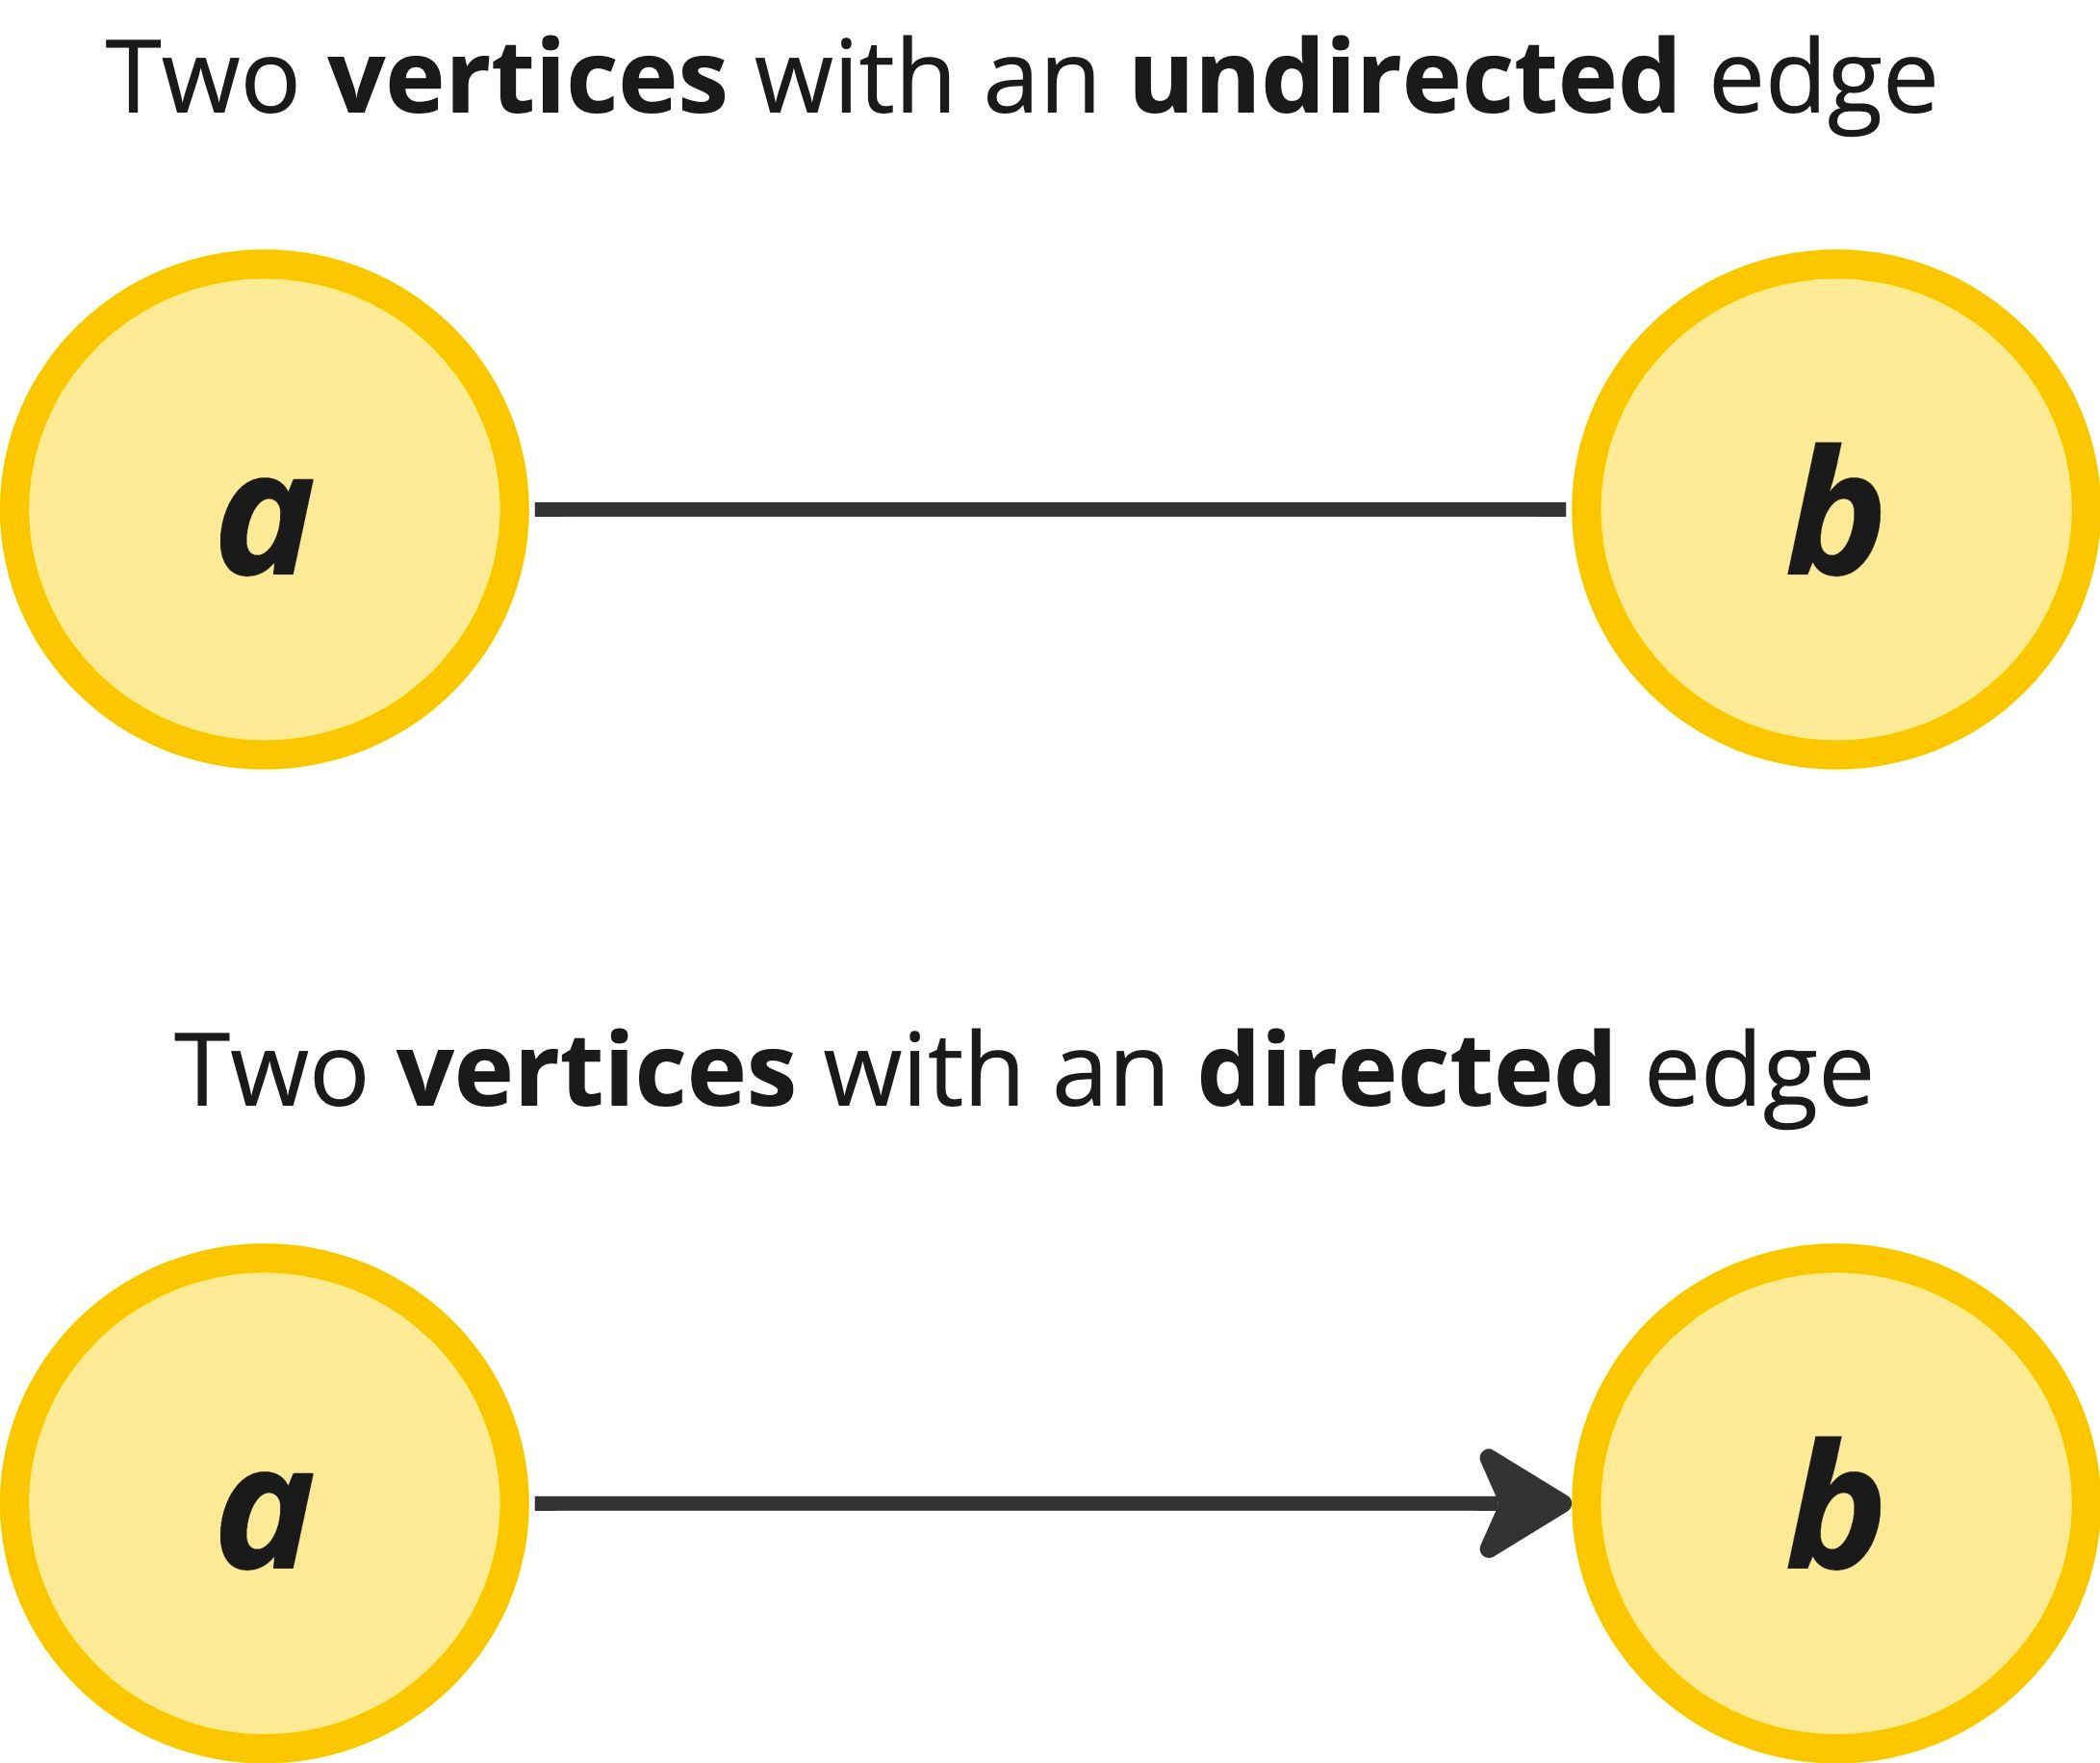
Each node in a graph can hold data and maintain connections to other nodes, signifying the edges. Unlike other data structures such as trees which impose how data can be linked (one direction parent-to-children relationships), graphs do not necessarily impose any restrictions, offering a more general data structure. There's no hierarchy or limit to the number of connections a node can have, and the connections can be either directed, signifying a one-way link, or undirected, indicating a two-way relationship.
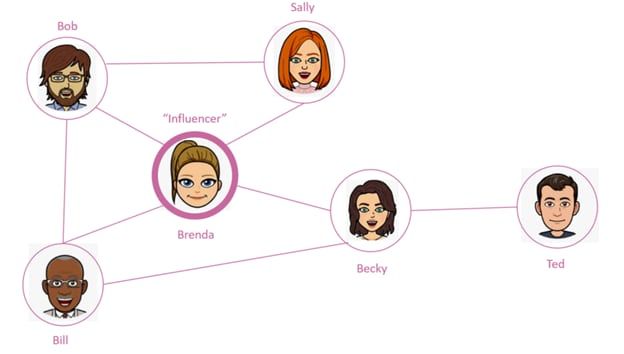
Social Media Is A Graph (image credit: https://dev.to/tamerlang/data-structures-graphs-2960)
The abstraction of a graph allows for the application of the same algorithms across diverse scenarios. For instance, in the realm of networking, graphs facilitate the analysis and optimization of transportation, computer, and communication networks by representing cities as nodes and highways as edges. Similarly, in social networks, individuals are depicted as nodes, and their friendships as edges. This versatility extends to computer networks where computers or routers are nodes, and cables form the edges.
Furthermore, graphs play a significant role in various domains of computer science and software engineering. They are instrumental in modeling social behaviors, driving recommendation systems, and enabling graph-based machine learning. In bioinformatics, graphs are utilized to illustrate genetic relationships, underscoring their wide-ranging applications. When you think about some of the biggest tech companies today, you'll see how they solve large scale problems that can fundamentally be thought of as graph problems.
| Company | Use of Graphs |
|---|---|
| Uber | Uses graphs to route drivers to their destinations. The nodes represent locations and the edges represent possible paths between locations. |
| Google's search engine uses graphs to connect users to webpages. The PageRank algorithm, which is based on graph theory, helps determine the importance of different webpages. | |
| Uses graphs to represent social networks. Each user is a node and each friendship is an edge. This graph is used for features like "People You May Know". | |
| Uses graphs for their "People You May Know" feature and job recommendations. The nodes represent users and companies, and the edges represent connections and job applications. | |
| Uses graphs to represent follower relationships. Each user is a node and each follow is an edge. This graph is used for features like "Who to Follow". | |
| Amazon | Uses graphs for their recommendation system. The nodes represent users and products, and the edges represent purchases and product views. |
| Netflix | Uses graphs for their movie recommendation system. The nodes represent users and movies, and the edges represent user ratings. |
Graph Terminology
Graph theory itself can be an entire class, but don't think you need stuffy college lectures to be good enough to pass a technical interview. There are a handful of commonly used terms you should be aware of and once you internalize these five bullet points you should be ready for almost any problem thrown at you!
As mentioned above, nodes are also sometimes called vertices.
Edges can be either directed or undirected. The former indicates a one-way relationship from a particular node to vertex, whereas the latter indicates the edge as bi-directional.
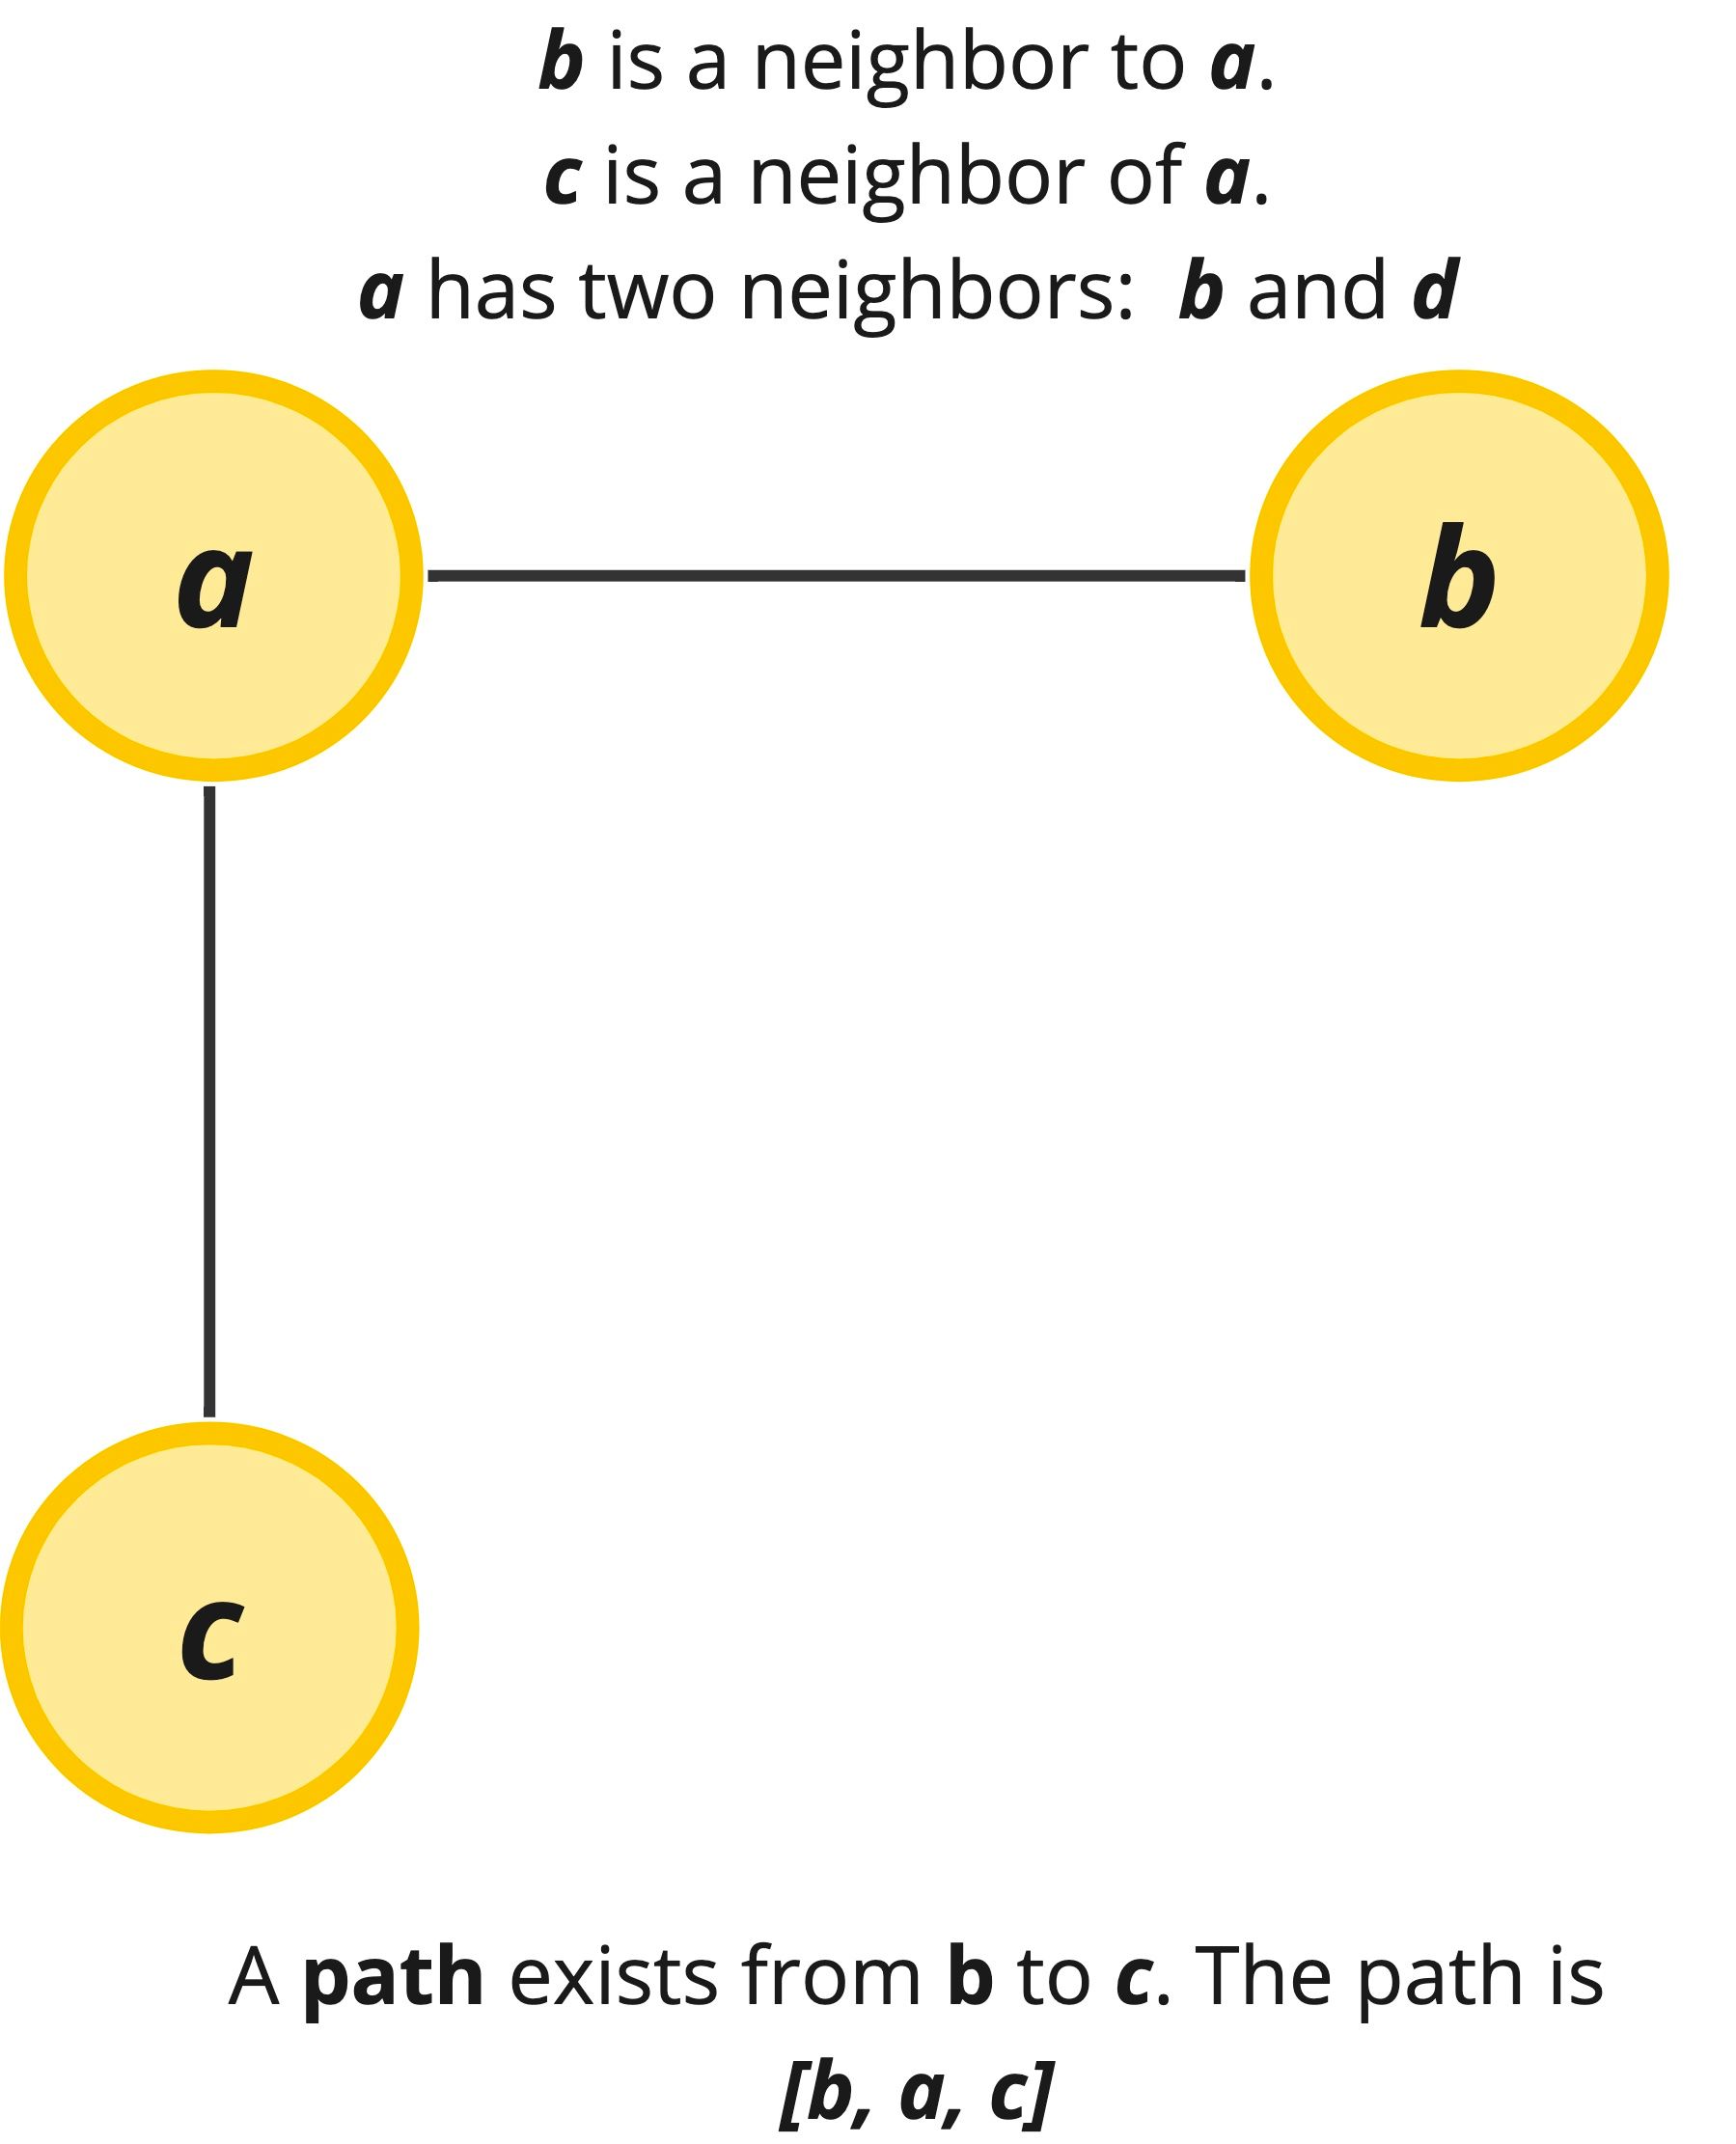
Two nodes are adjacent (aka neighbors) if an edge connects them together. And a path is a particular permutation of edges in the graph.
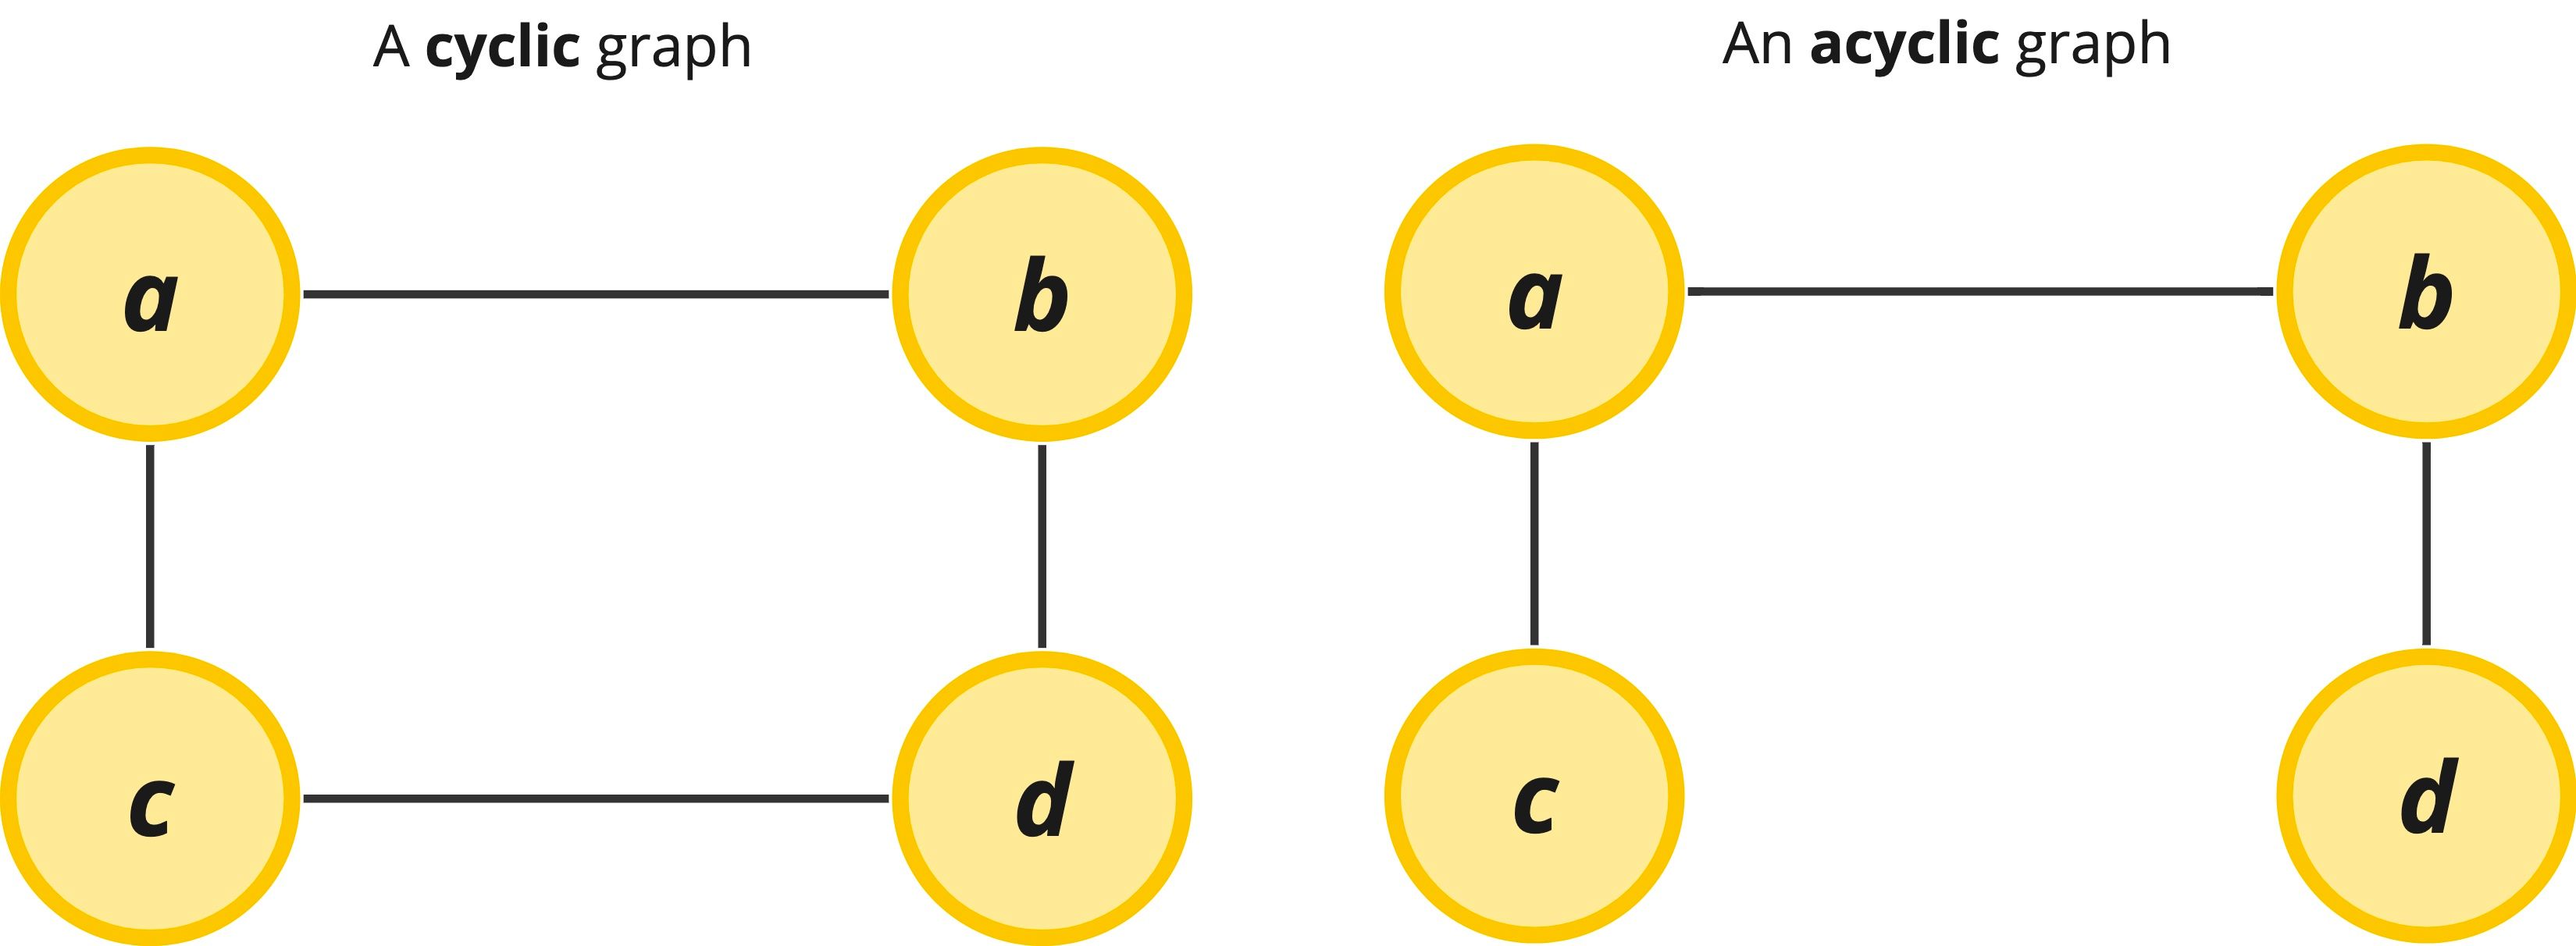
Graphs sometimes can have loops in them. If the graph contains a loop, we call the loop a cycle and if it has no loops it is known as acyclic.
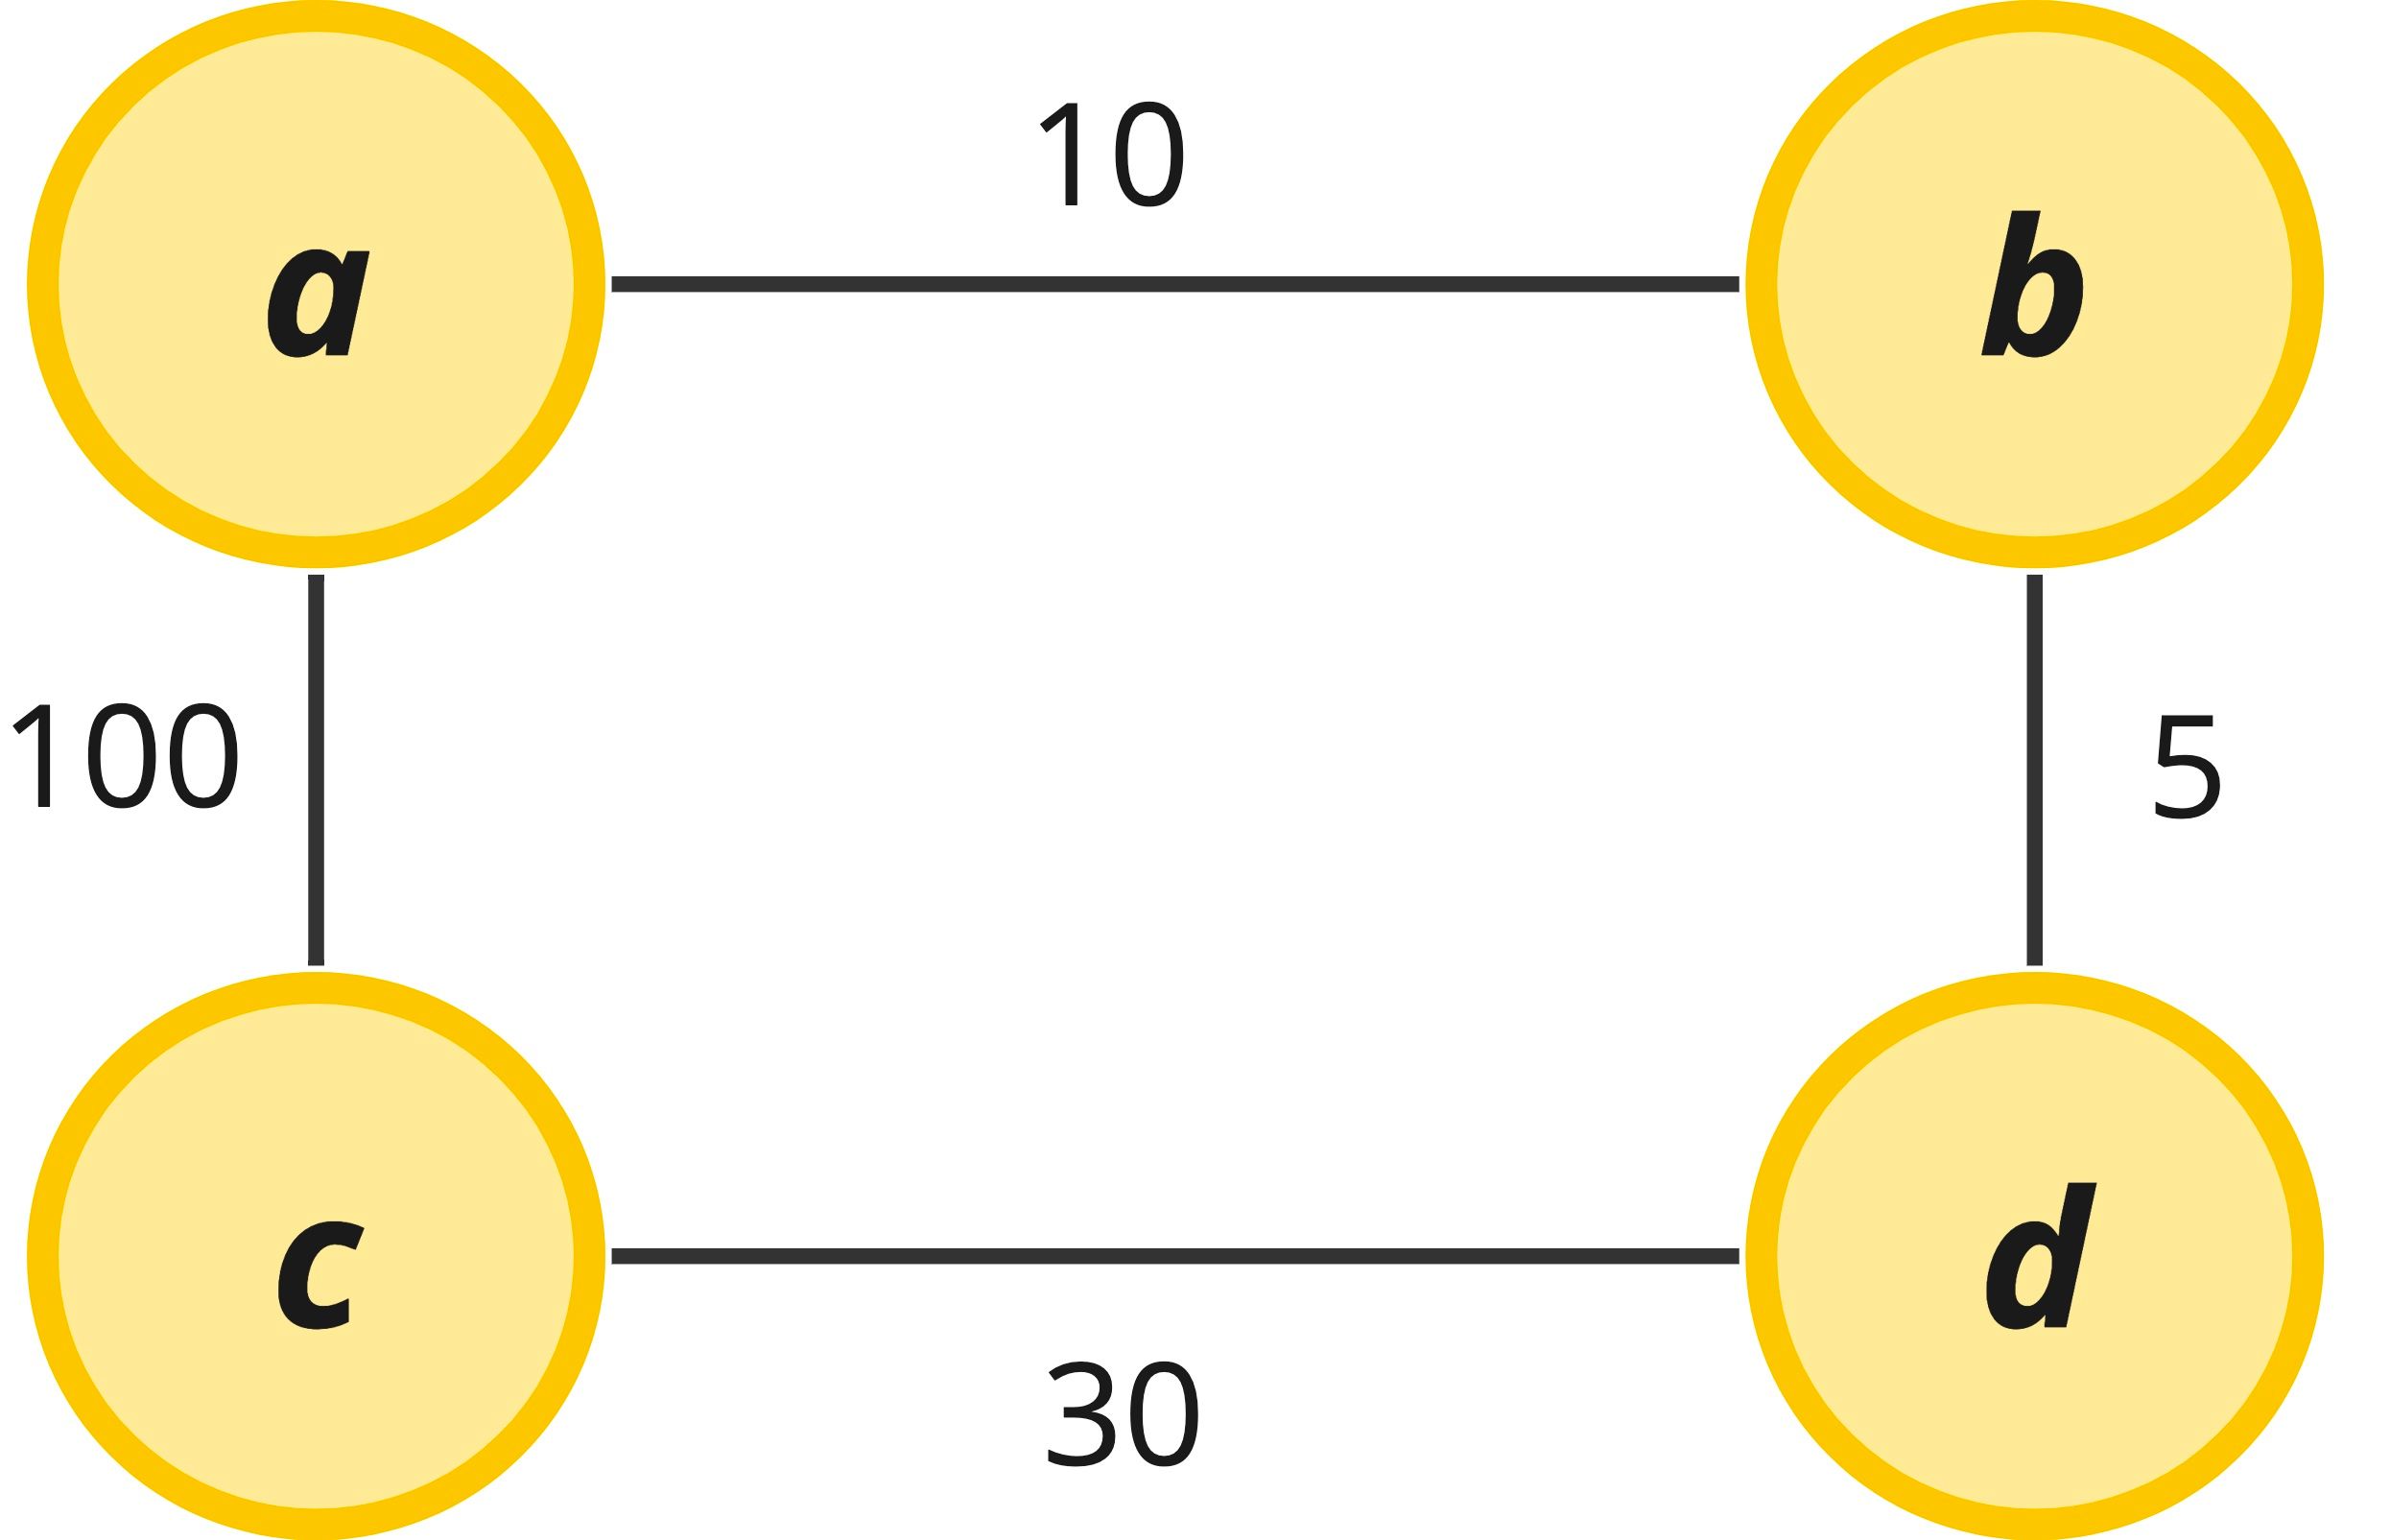
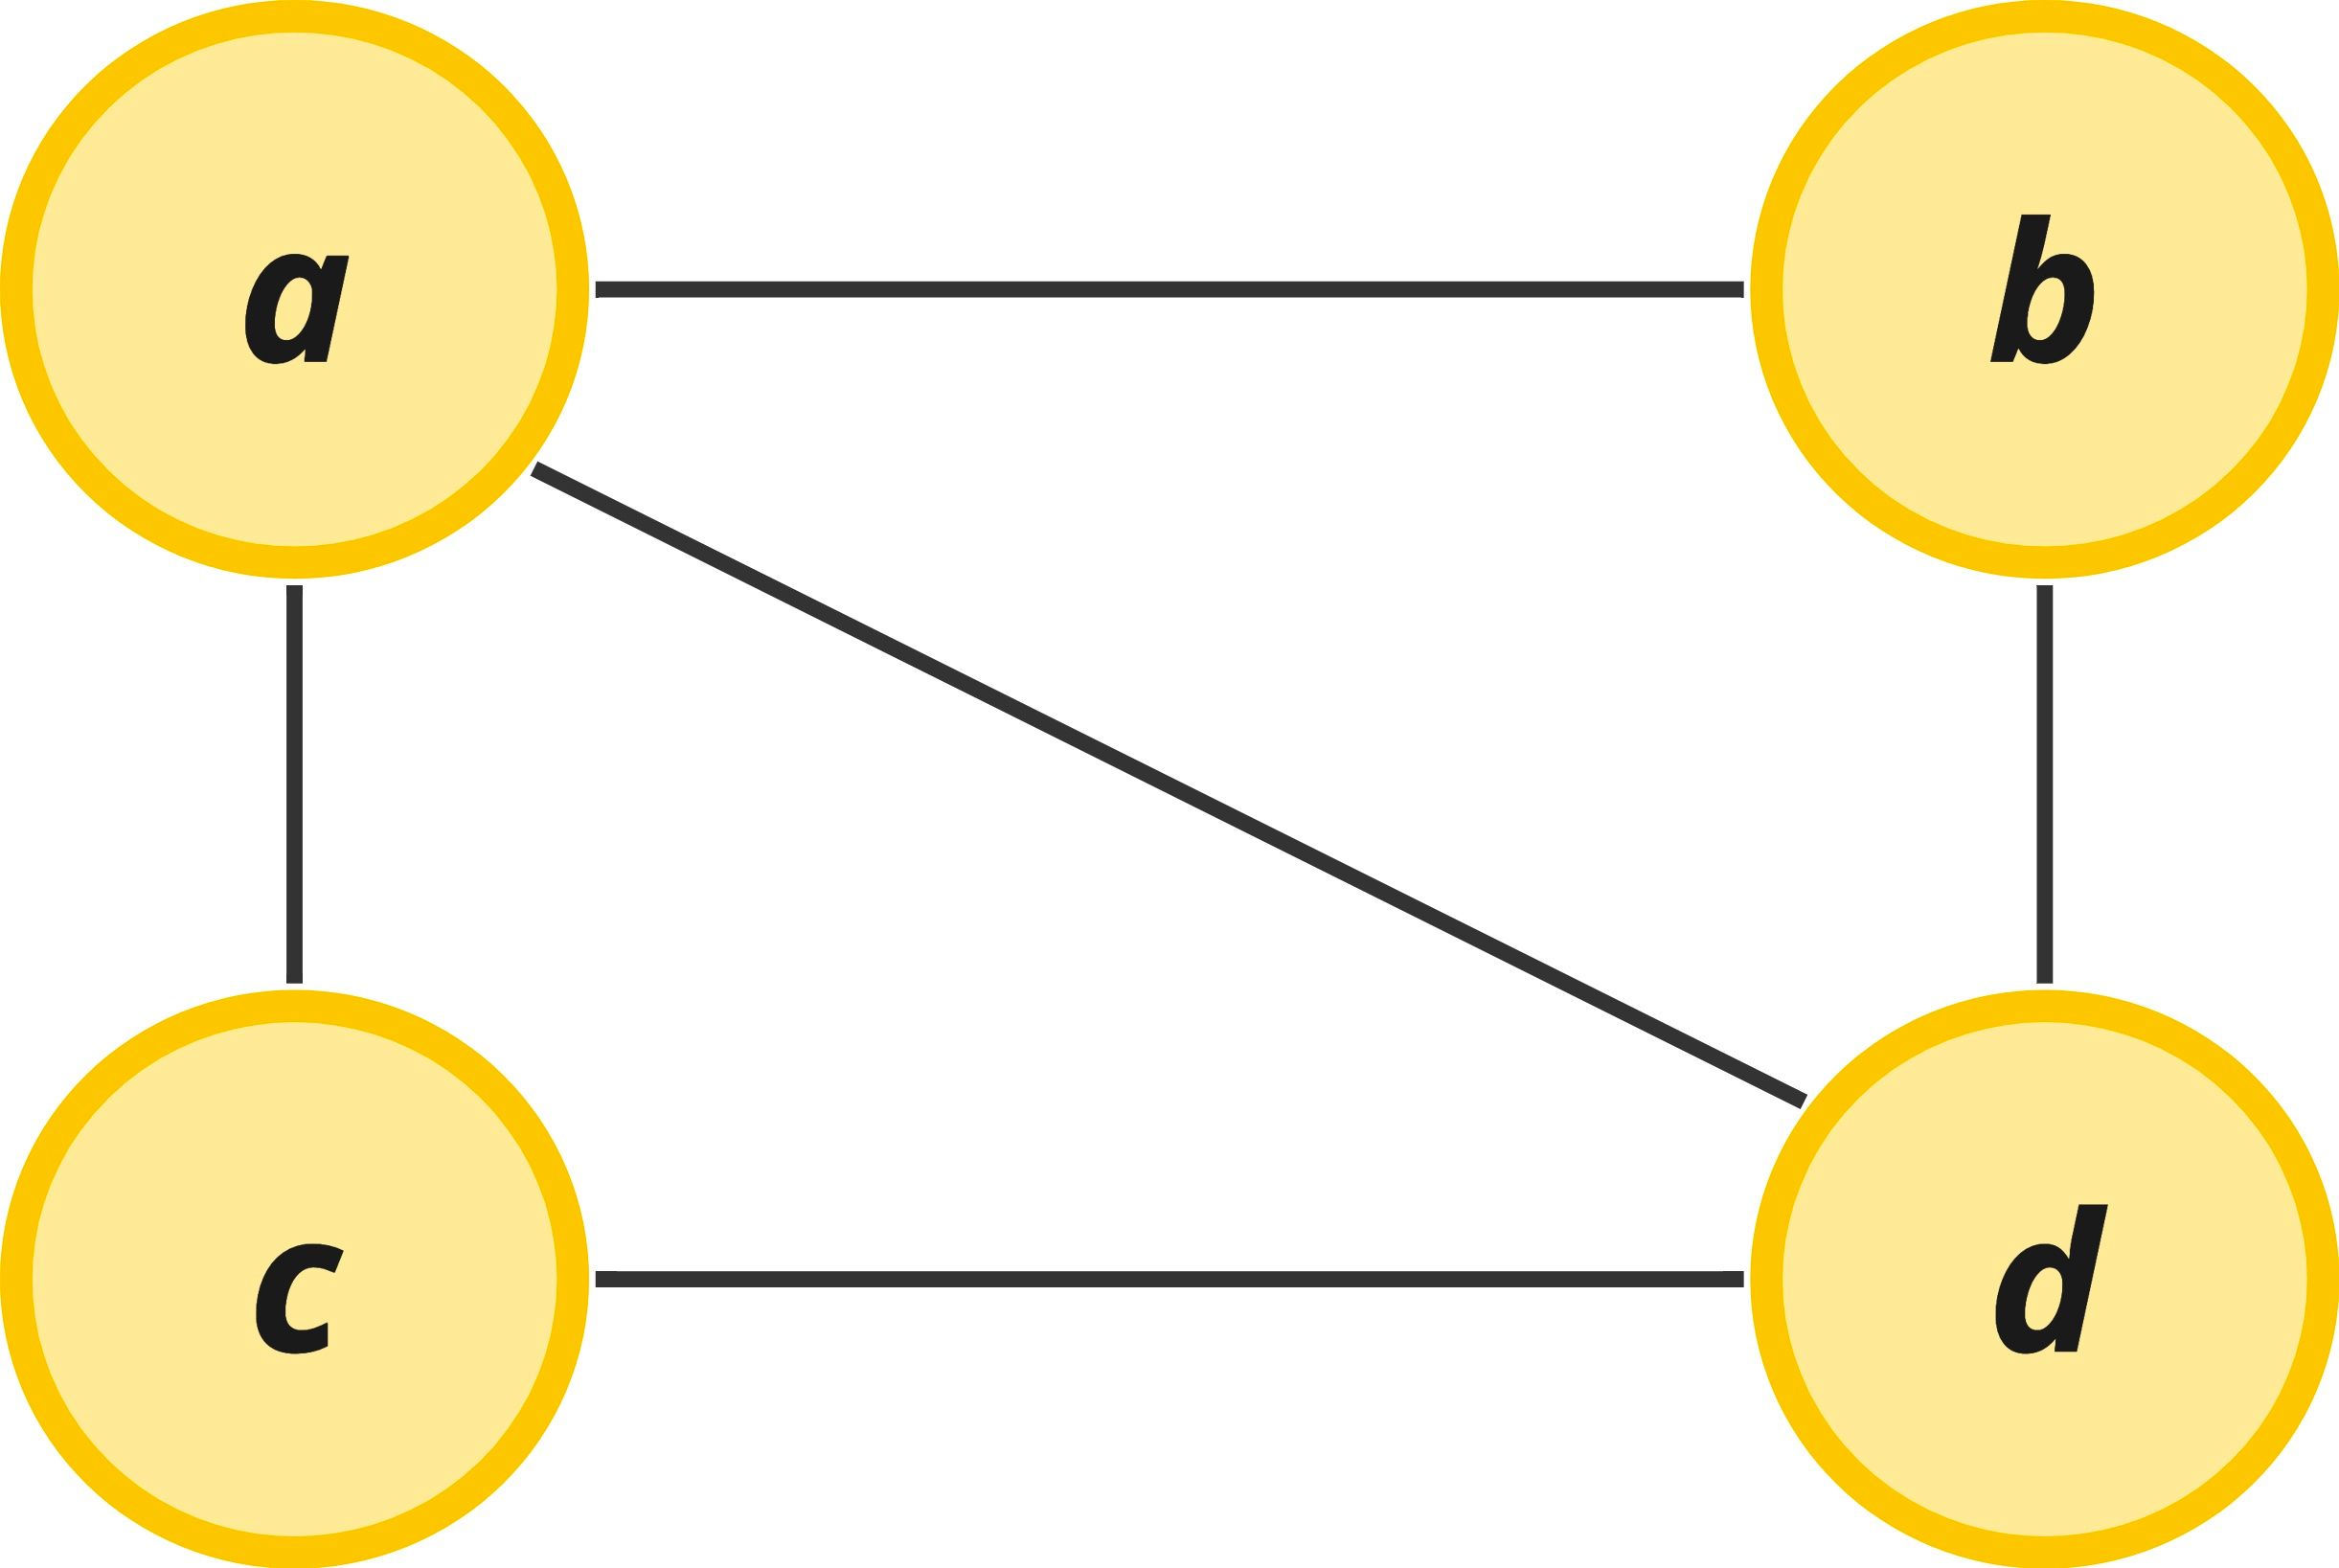
Usually in more complicated graph problems, we might see weights assigned to our edges to illustrate different costs associated with traveling along a particular edge. In the example below, it costs more to travel from node a to node c if we go directly to it (a total cost of 100), but it is much cheaper to go through node b and node d and still reach the same destination (for a cost of just 45). Weights are especially useful in path finding algorithms.
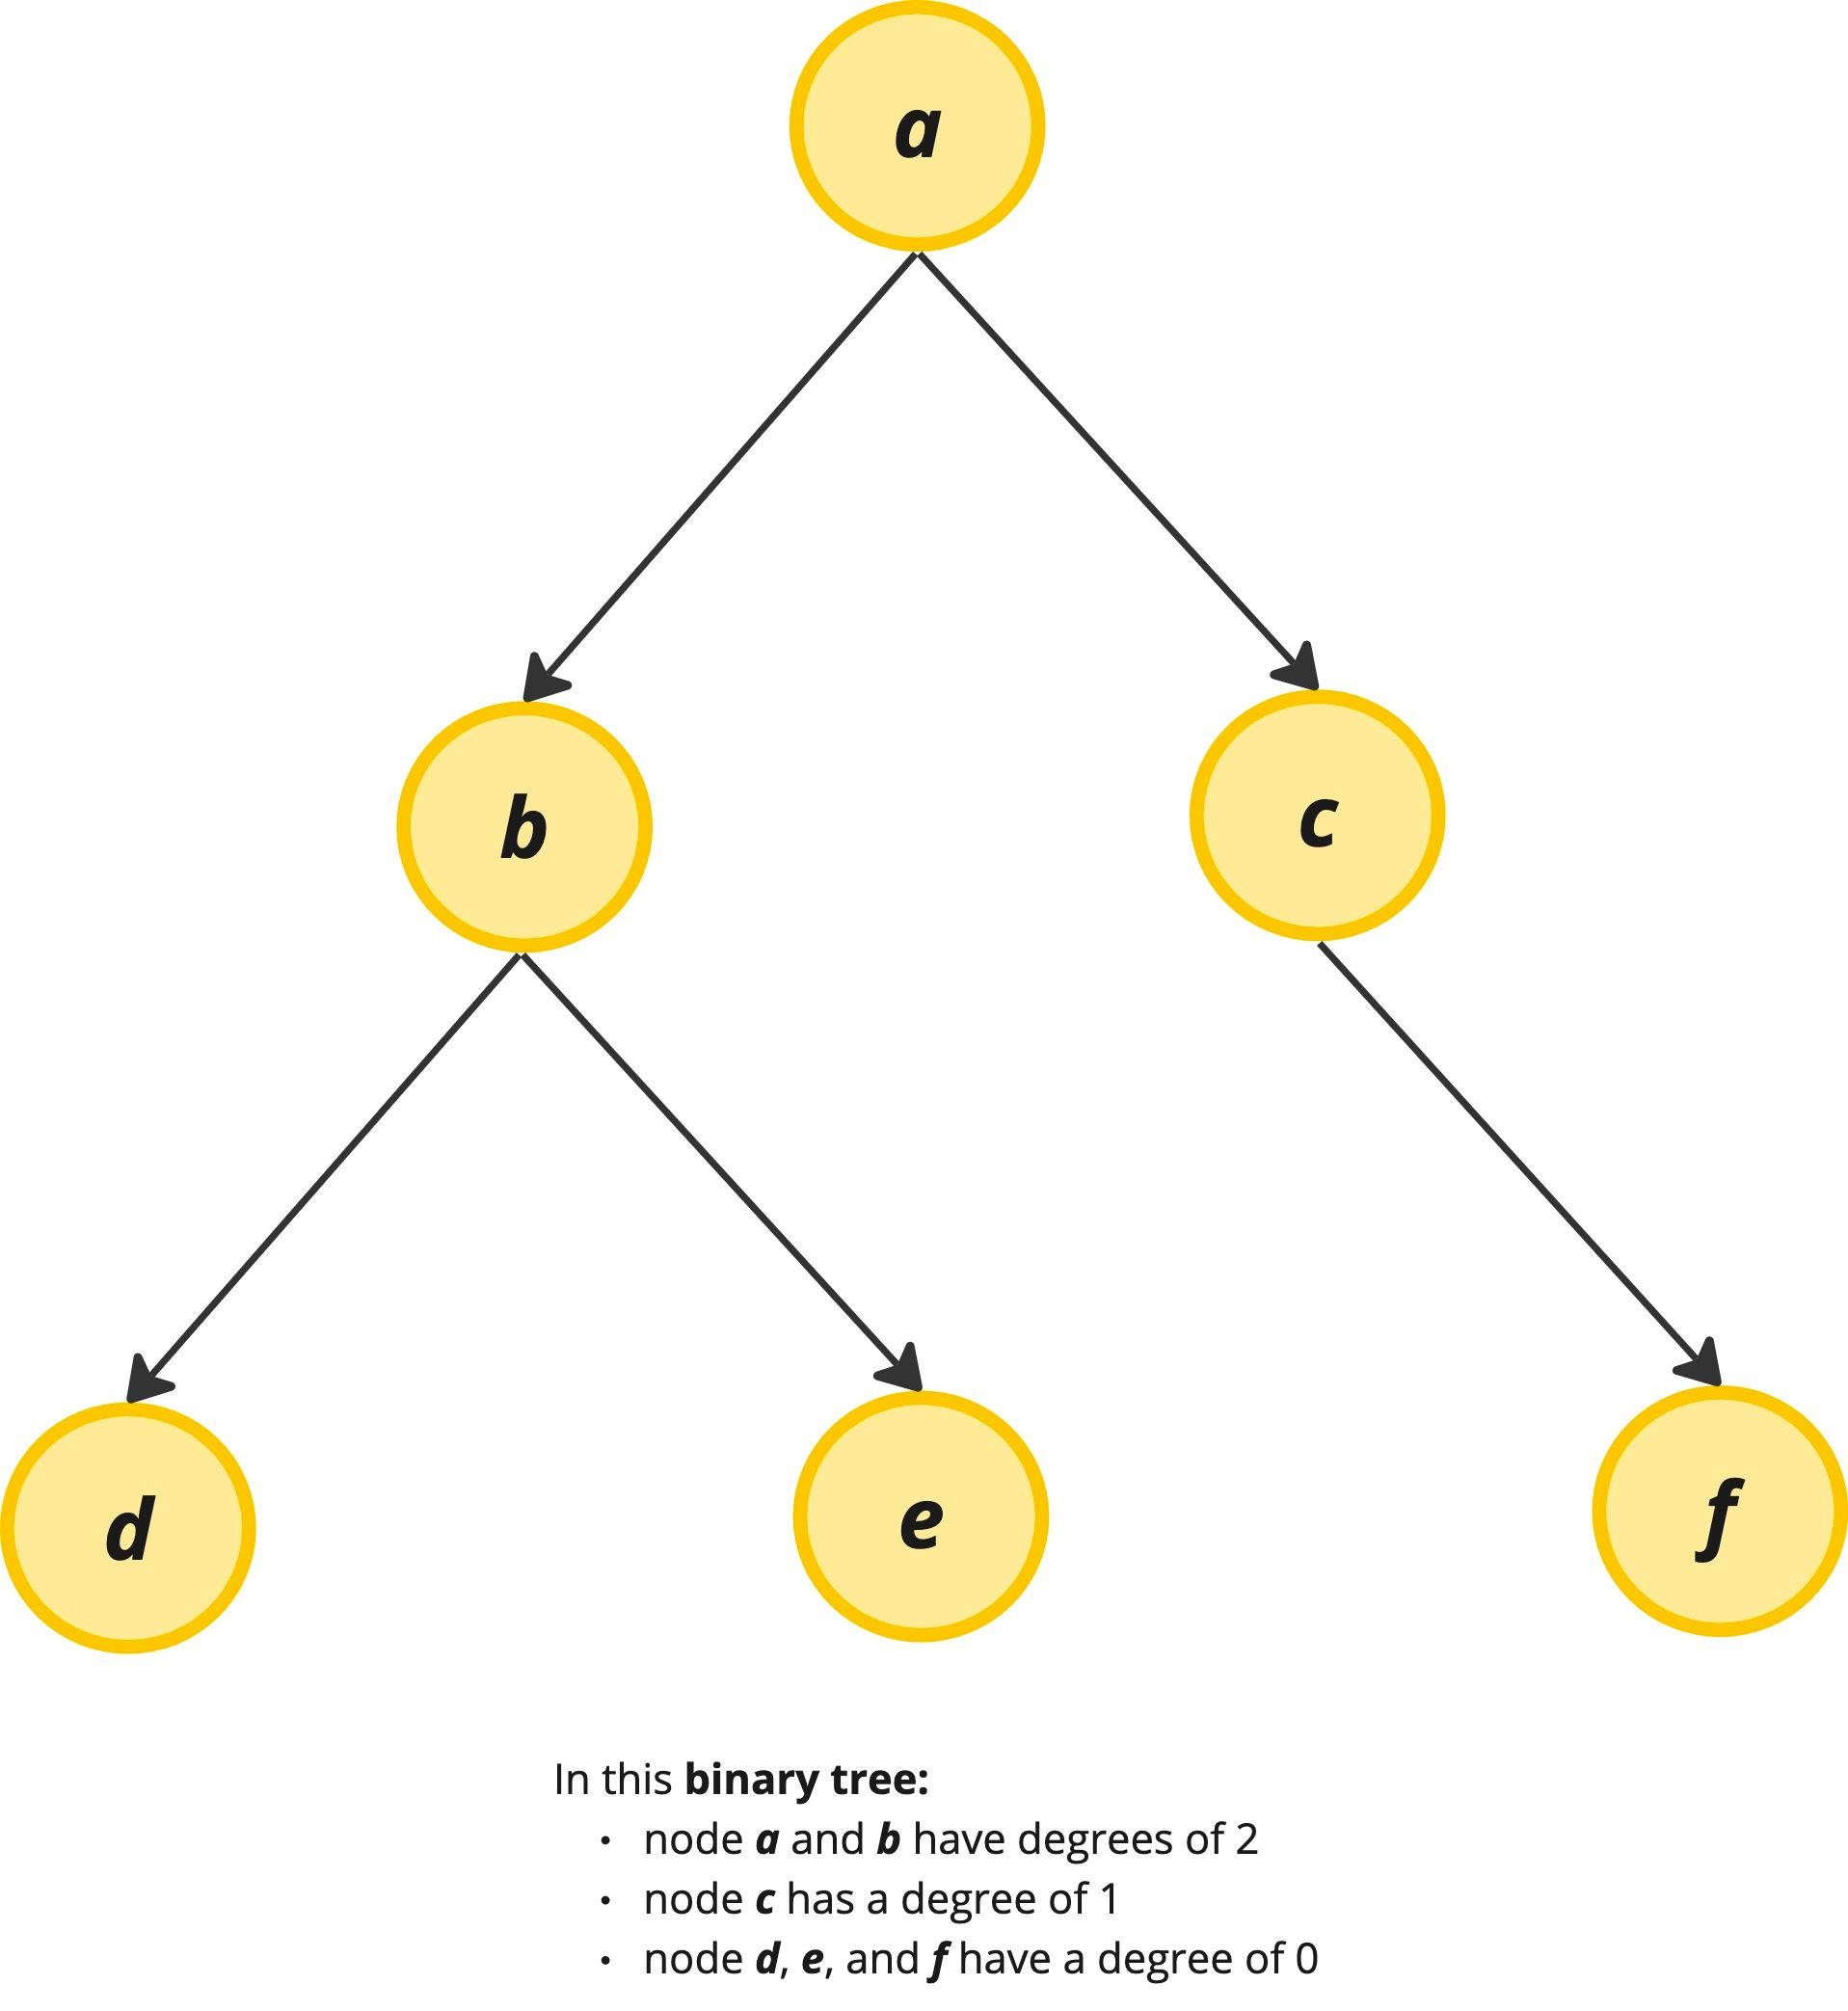
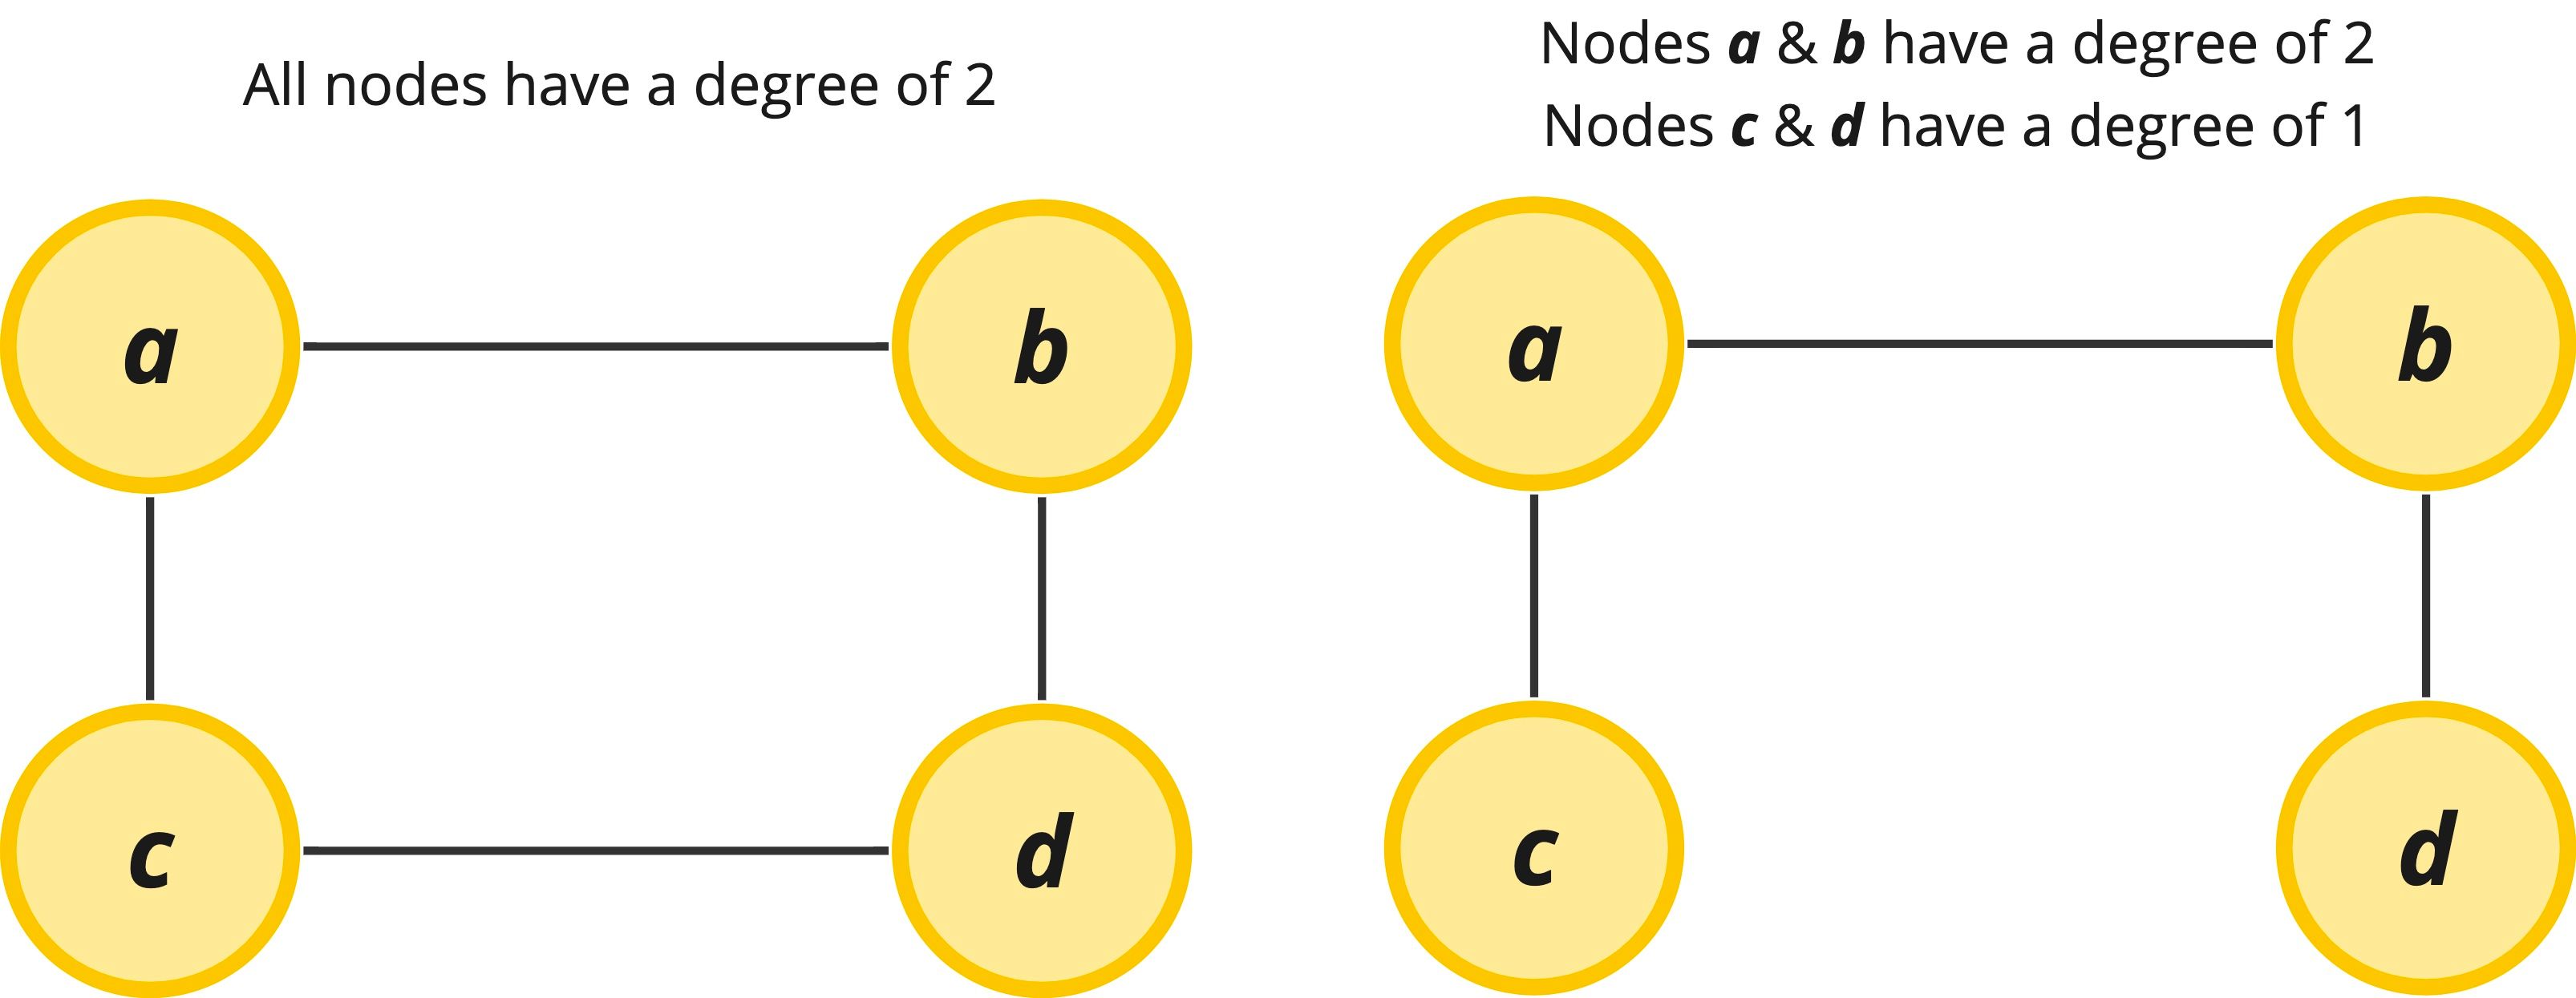
Finally, degree is a term that comes up in the time and space complexity analysis of graph algorithms. The degree simply refers to the number of edges that are attached to a particular node and is expressed in the form deg(V). Because this is node-specific terminology, the degree can change in the same graph depending on what node we are referring to. Occasionally we will need to know what the overall degree of a graph is, which can be expressed as the average degree – this is just what it sounds like, averaging out the degree across nodes and usually written as avg deg(V). In a binary tree, for instance, we can have 0, 1, or 2 edges attached to any node. The worst case degree of the tree is 2 since the worst case is that the tree is complete and contains a maximum of two children at every level except at the final terminal level.
Unlike in a binary tree, in graphs, we can have an arbitrary number of edges attached to a given node, so the degree can vary wildly depending on which node we are talking about in the graph.
There exist many other terms for graphs, but these terms tend to be more academic and less applicable to interview questions. If you have extra time in your interview prep you might consider also studying:
- Connected and disconnected graphs along with the related idea of connected components
- Sparse and dense graphs
- In-degree and out-degrees of graphs
- Big-O notation of graphs, specifically in relation to their vertices and edges
Graph Math
If you are unfamiliar with graph nomenclature, you might be frightened by how some Computer Science egg-heads chose to represent graphs… mathematically. 🙄
You'll typically see mathematical notations representing graphs that look something like this…
- G = (V, E)
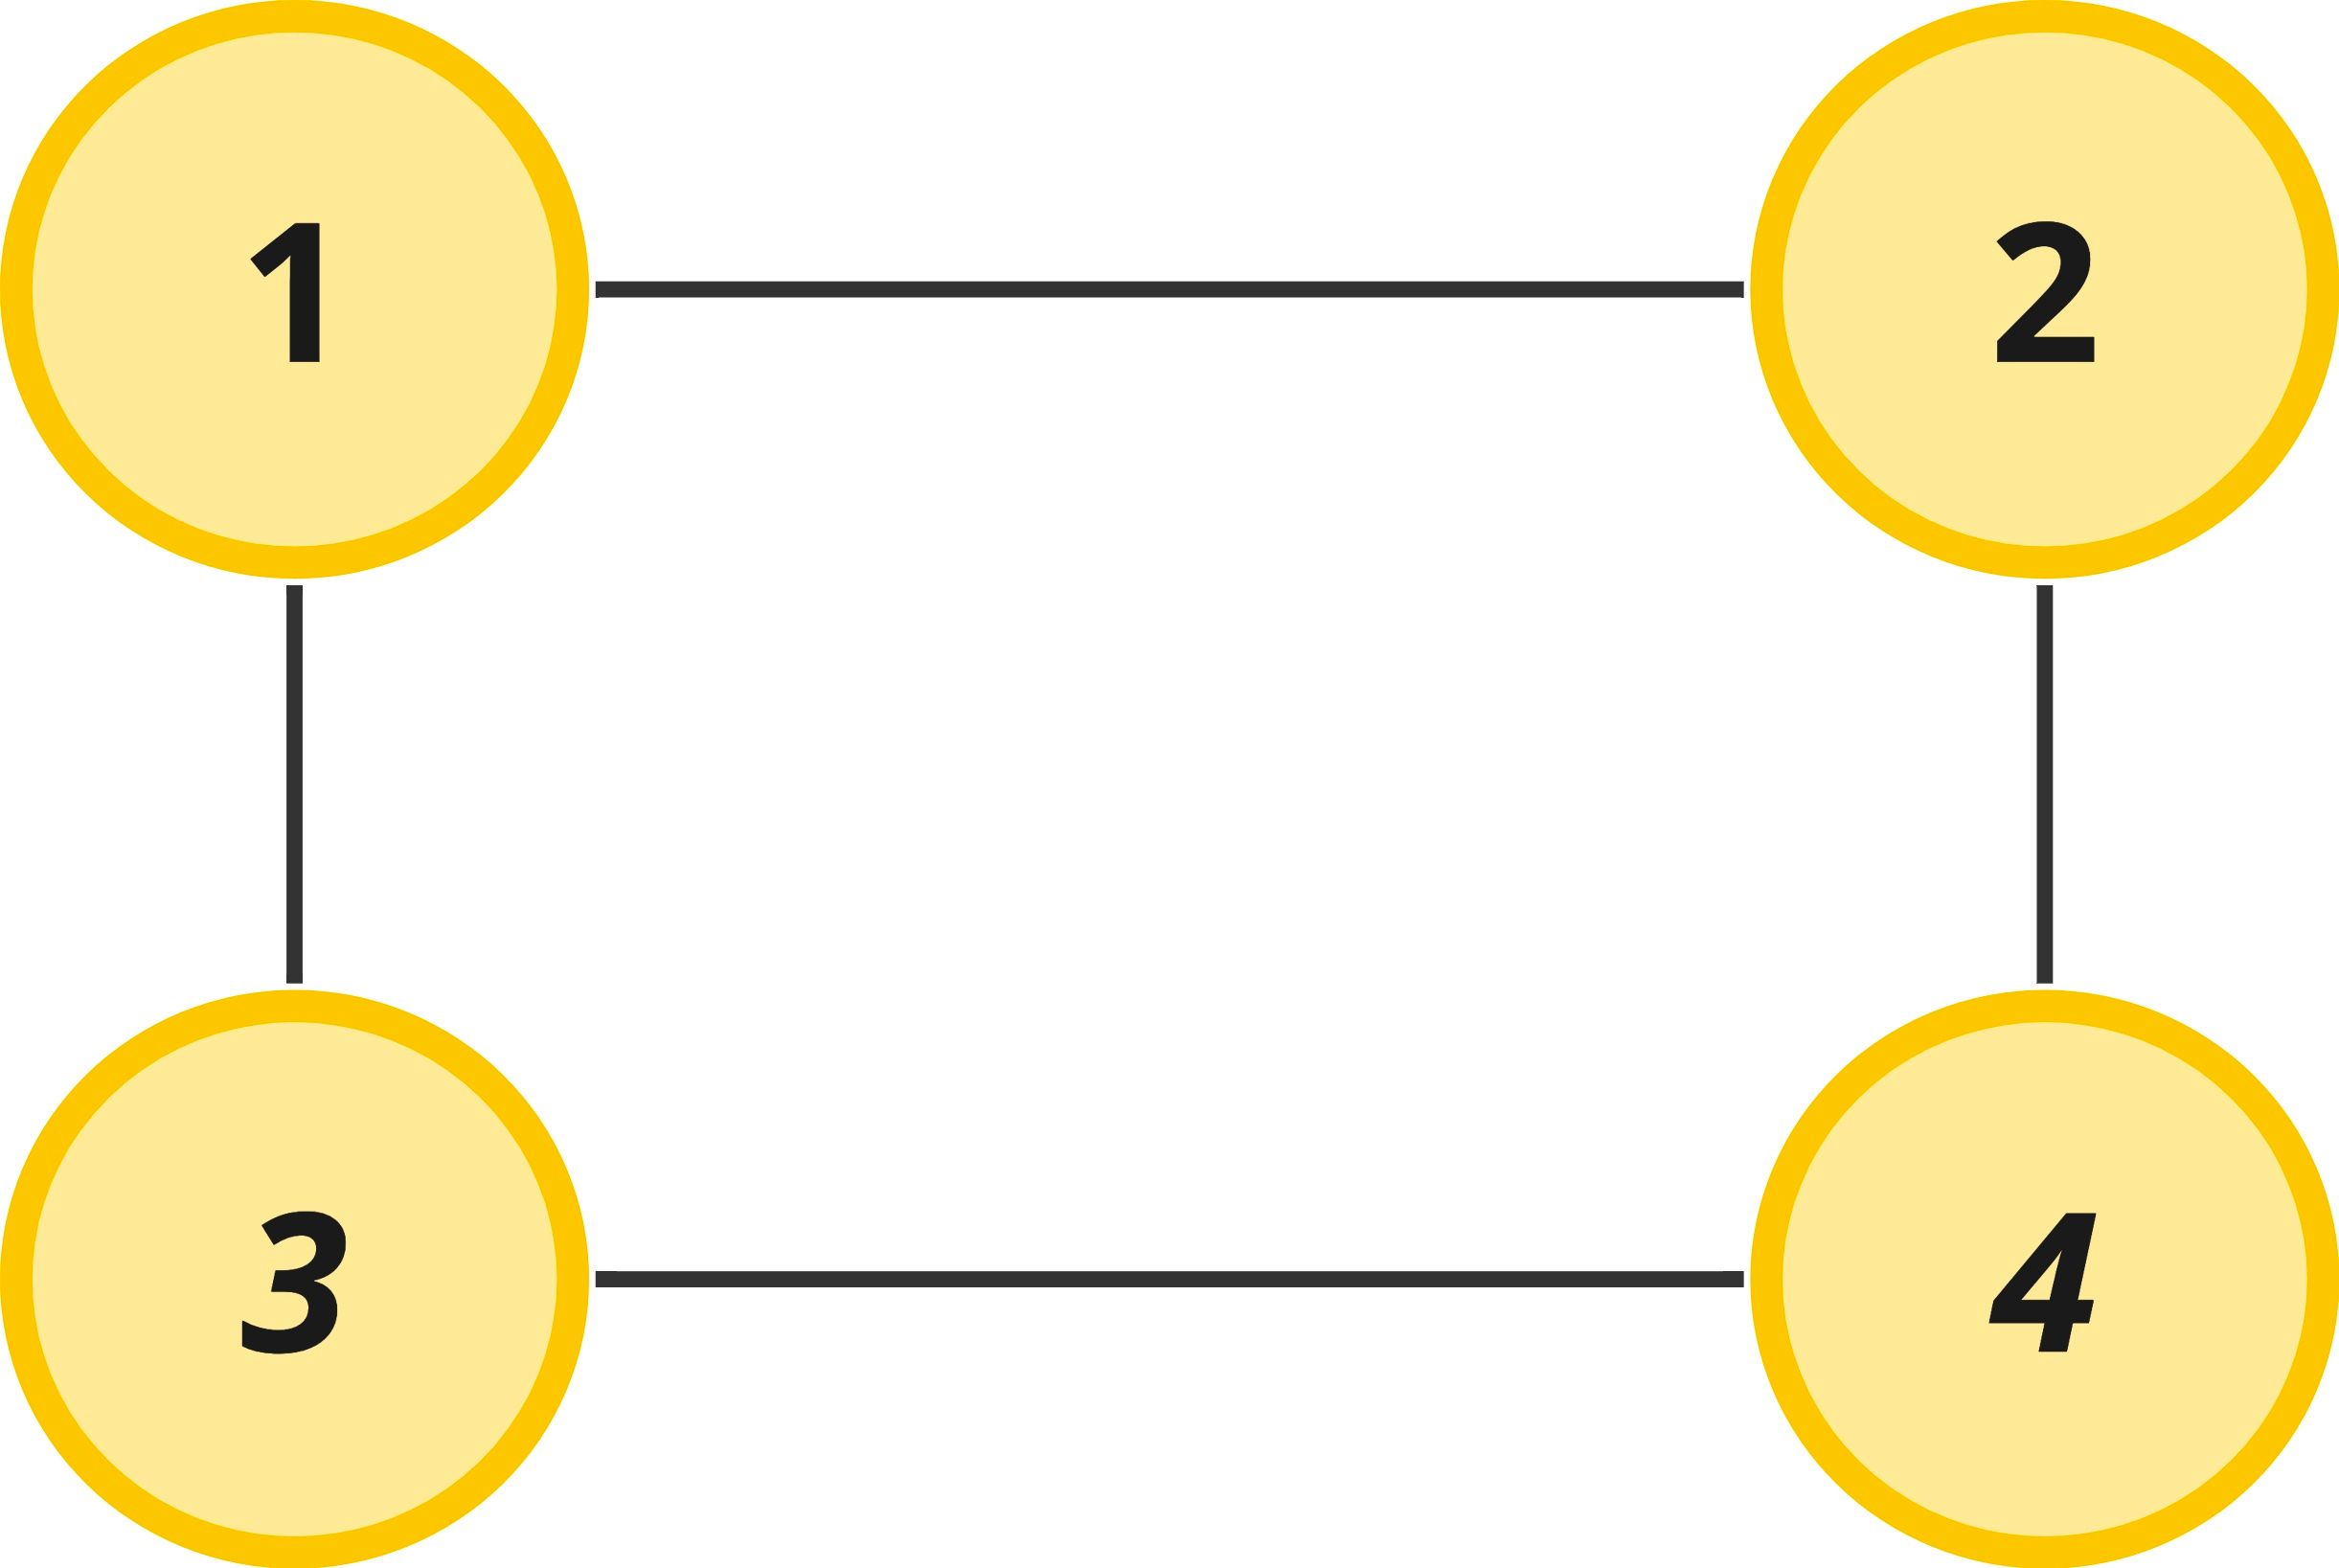
- V = {a,b,c,d}
- E = {{a, b}, {a, c}, {a, d}, {b, d}, {c, d}}
In the paragraphs above, we have already learned everything we need to know to understand this jargon. The first bullet point simply states that a Graph is composed of Vertices and Edges. The second bullet denotes the Vertices in the graph are labeled a, b, c, and d. The last bullet describes the Edges that exist in the graph. In this case vertex a connects to vertex b, a connects to c, etc. If we were to visualize this graph described above, it would look like this:
Different Graph Representations
So we now understand why graphs are important and many of the key terms associated with them. You've probably seen trees in the past and how they are represented, but how are graphs represented in code? Trees are hierarchical by definition and have the root as an obvious starting point for doing graph problems. Graphs differ from trees in that they don't have an obvious place to start an algorithm. There is no "beginning" node to work from. As a result, all the nodes in a graph are often assigned a key and listed in a data structure that allows for random access and for tracking the connections between nodes. The "real" data stored in a node is often mapped to an additional object based on the vertex key.
Let's look at a couple of ways that the below graph can be represented in code.
Edge List
This is one of the most common ways you will be given a graph in an interview question. You can describe a graph completely by listing out the edges associated with the graph. If you have all the edges, then you can logically understand how the graph is connected together.
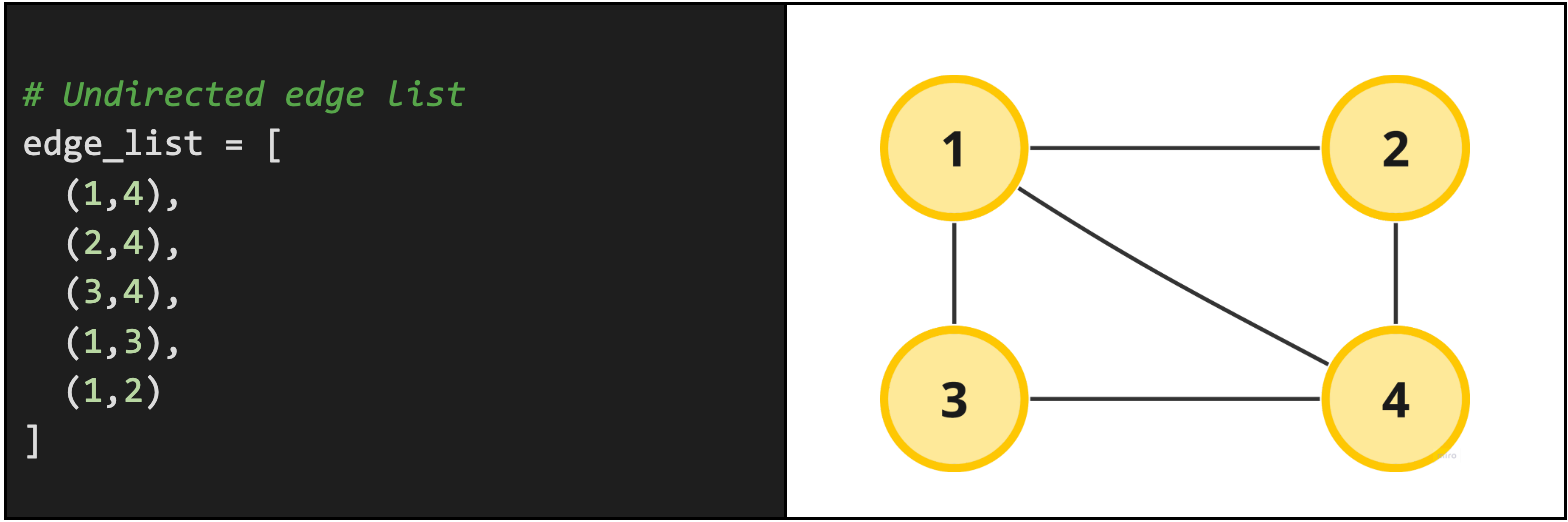
Notice by default we assume that the graph is undirected. This is an assumption you should always clarify with your interviewer. For instance, they could tell you that the exact same edge list is a directed edge list with node-neighbor relationships. We read the relationship from left-to-right, i.e. for (x, y) node x is directly connected to node y. Graphically, that same edge list would represent a slightly more precise graph with directions like the one below.
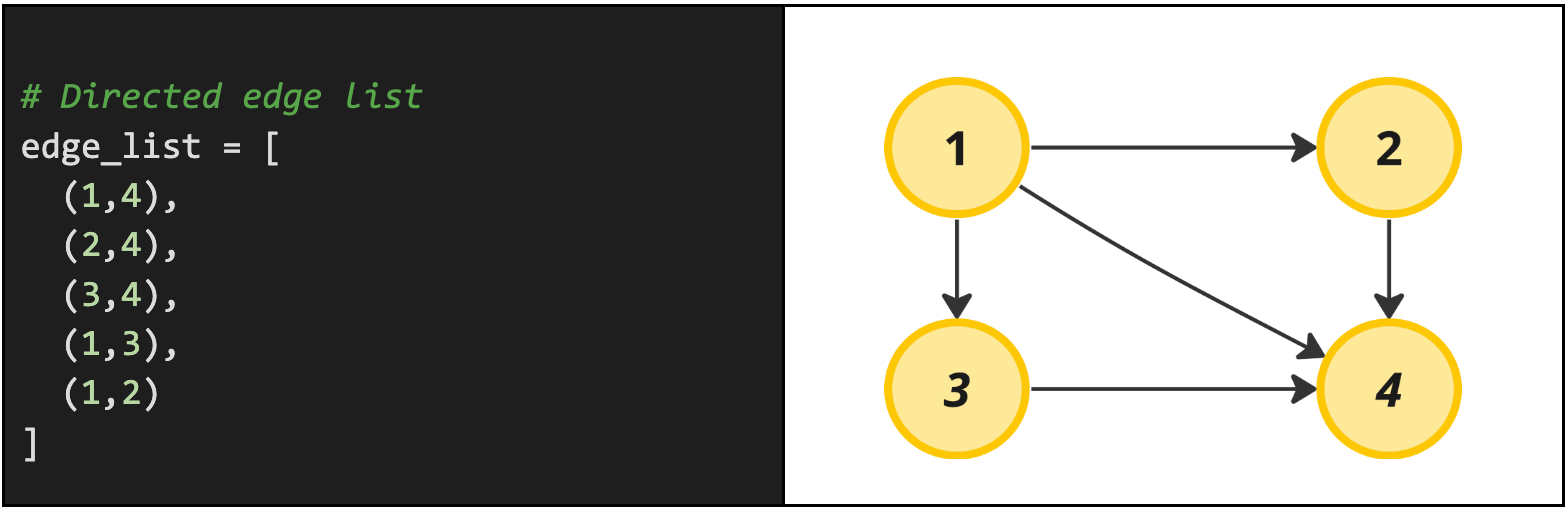
Real problem example: A good interview problem example with a directed edge list would be the Course Schedule problem.
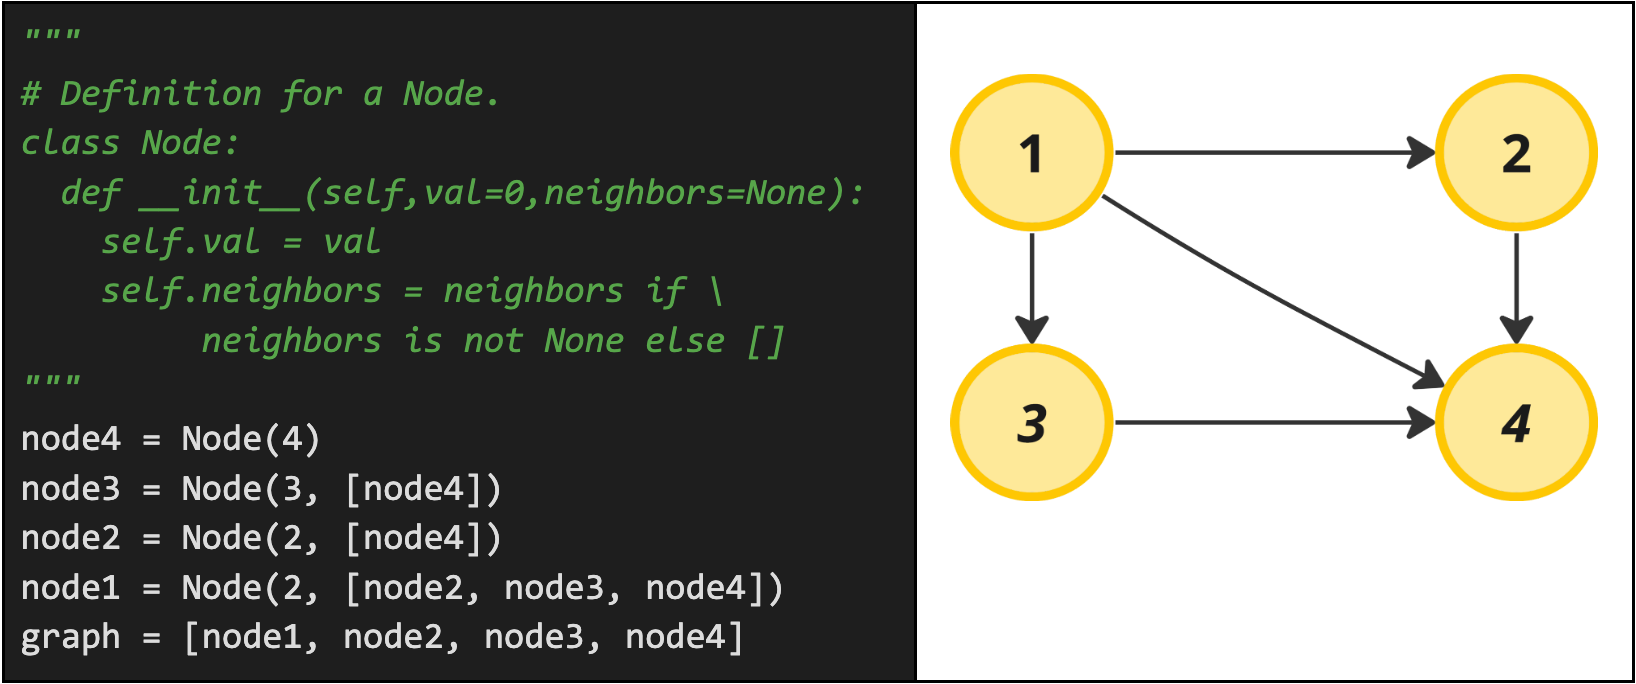
Objects & References
If you come from an Object-Oriented background, it may feel natural to represent a graph as objects and then lists of references to other objects. You can make a node class, store node data in that class, and then store a list of references to other nodes that are neighbors to that node. While this may seem natural, storing graphs as nodes and list references has a lot of data overhead associated with it and we will learn better methods to represent graphs below. However, this costly graph representation does show up occasionally in interviews, so it is still worth mentioning:
Real problem example: Clone Graph
Adjacency List
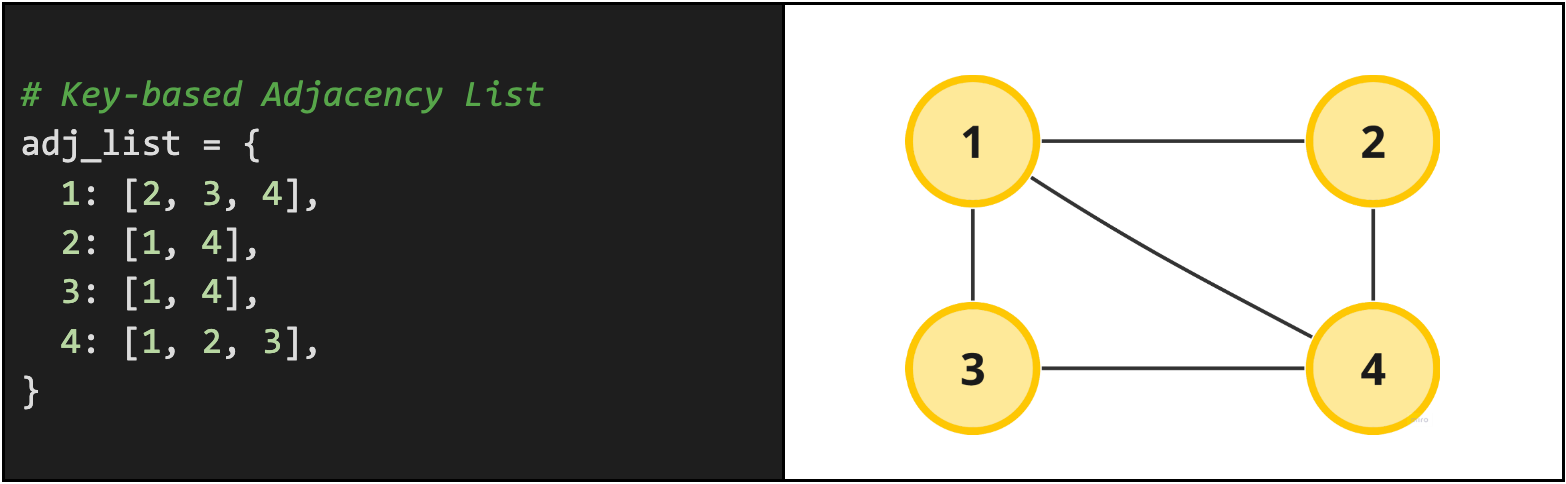
By far the most common way to use a graph is to make an adjacency list. An adjacency list is a way of representing a graph using an array or some key-value store. Key-value data structures are called by different names in each language, so be sure to get familiar with your language's version of the data structure which could be a Map, Dictionary, HashMap or even just a plain object. See the Hash Table guide for more details on this!
An adjacency list is a list of vertices with references to the edges of each vertex. We can enumerate the nodes as keys in an object (or as indices in an array) and set the value to each key as a list of associated edges. This allows us to easily find all the nodes that any given node connects to, which makes accessing connected nodes fast. If we were trying to see all nodes that were connected to node A using an edge list, it would take linear time to the number of vertices in the graph. An adjacency list lets us access the connected neighbors in constant time.
An example adjacency list in python can be seen below using a dictionary where the node is stored as the key and the neighbors for the node are stored as the values for the key. For additional speed, you can store values in the hash table as sets instead of lists assuming order does not matter and duplicates are not possible. This allows you to additionally ask questions like "does node X have node Y as a neighbor" in constant time. The below example just stores values in a python list.
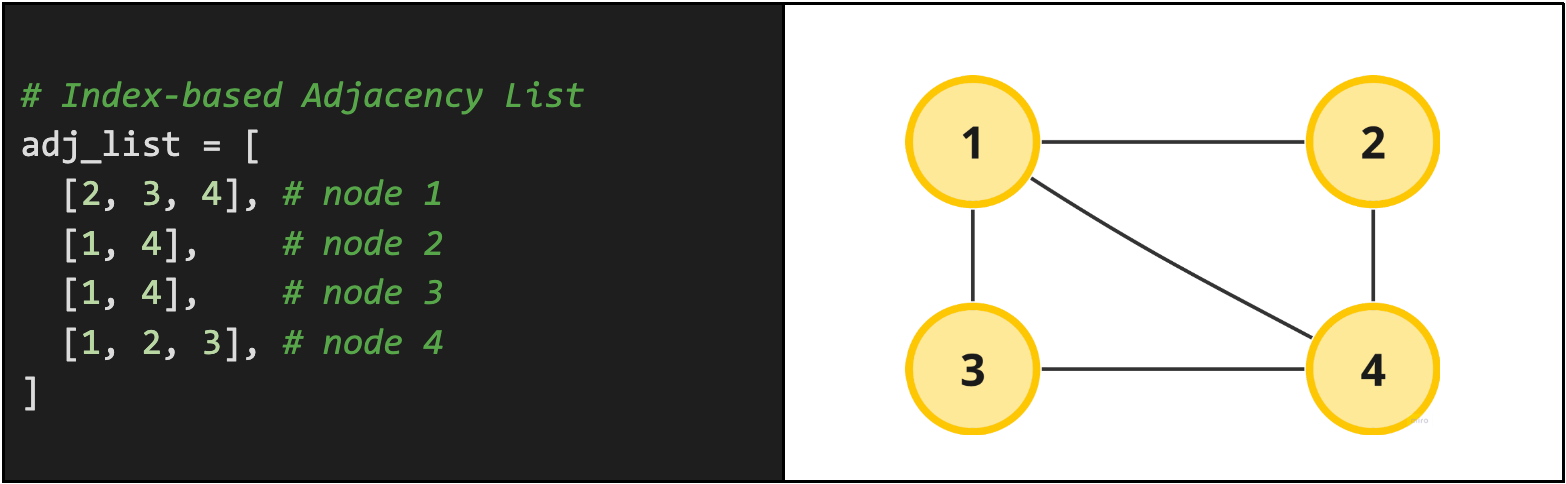
Another common way to represent an adjacency list is just as a list of lists. The first element in the list represents the first node, the second element represents the second node and so on. Here's what that would look like:
Real problem example: Keys and Rooms
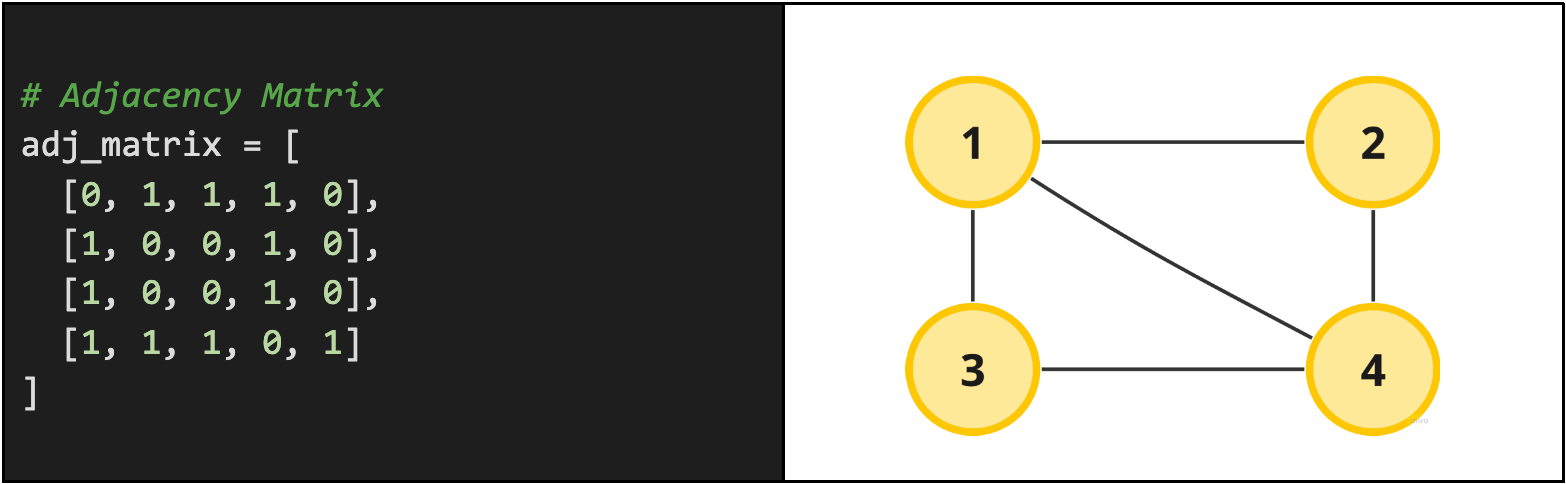
Adjacency Matrix
An adjacency matrix is similar to our adjacency list except that it explicitly defines every possible edge in the graph. Using a 2D matrix of size O(V * V), where V is the number of vertices in the graph, each cell in the matrix represents an edge between vertex one (the row) and vertex two (the column).
Rather than only tracking the edges that do exist, an adjacency matrix is a boolean matrix that contains every possible edge and tells us either 1 (it exists) or 0 (it does not exist). Checking for the existence of an edge between two vertices can be done in O(1) (constant) time since we can index directly into adj_matrix[v1][v2].
This is arguably one of the most confusing graph representations to look at, so if this is confusing to you, check out a more detailed explanation of 2D matrices in Arrays! Don't stress because this graph representation type is generally uncommon to occur in real interviews for reasons outlined below.
Real problem example: Find the Town Judge
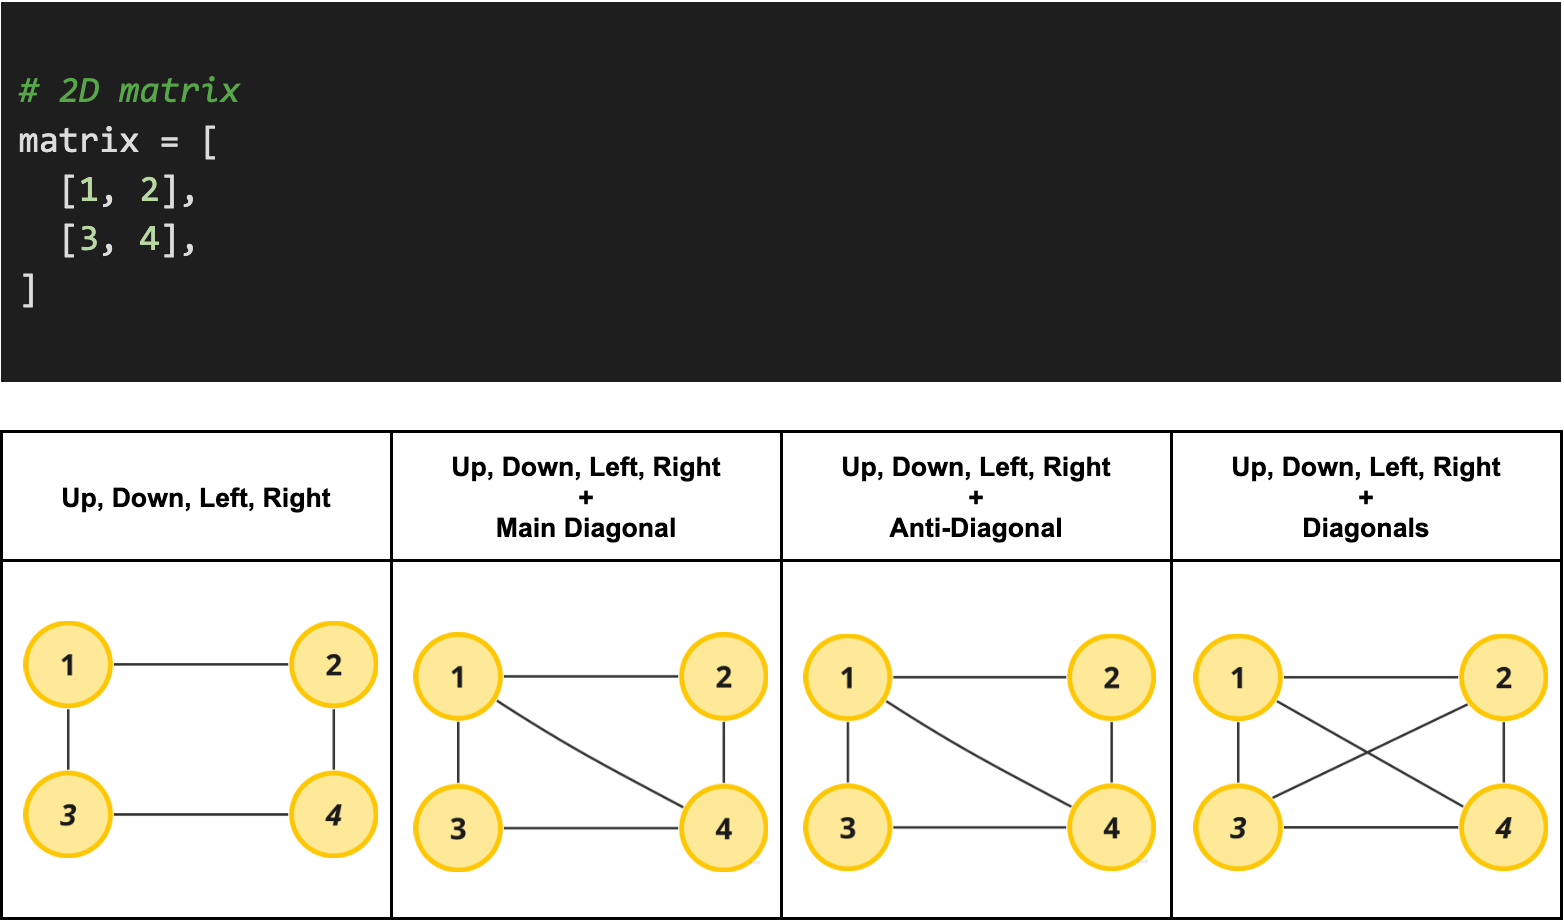
2D Matrix
The last and arguably most common way graphs are represented in interview questions are through 2D matrices (nested lists). This differs from the adjacency matrix mentioned above, because the adjacency matrix specifically iterates all possible connections between all possible vertices whereas 2D matrices on their own express edges by their location relative to one another. Conceptually, there is nothing special about 2D matrix graphs.
Real problem example: Count Islands
Best Graph Representation
After looking at this list, you may question which graph representation is "best", but the truth is that it just depends on how we plan to reference the data structure in our code. In most interview problems, you'll find that an adjacency list tends to be a preferred for a few reasons: 1) it is more compact for sparse graphs and 2) if a node has a small degree, it is much faster to iterate through its neighbors. In contrast, the main advantage of the adjacency matrix is being able to check if two nodes are adjacent in constant time. Sometimes, it even makes sense to use both in the same algorithm, but usually not in coding interviews.
| Edge List | Objects & References | Adjacency List | Adjacency Matrix | 2D Grid as a Graph | |
|---|---|---|---|---|---|
| Pros | Simple to implement. Good for sparse graphs. | Intuitive, especially for object-oriented programming. Good for representing complex data. | Efficient for many operations. Good for sparse graphs. | Very efficient for checking if an edge exists between two nodes. Good for dense graphs. | Intuitive for grid-based problems. Easy to calculate neighbors. |
| Cons | Inefficient for many operations, such as checking if an edge exists between two nodes. | Can be memory-intensive. Not as straightforward for certain algorithms. | Not as efficient for dense graphs. | Can be memory-intensive, especially for large, sparse graphs. | Only suitable for grid-based problems. Not as flexible as other representations. |
| Space Complexity | O(E) | O(V + E) | O(V + E) | O(V^2) | O(R * C) |
| Insert Node | O(1) | O(1) | O(1) | O(V^2) | N/A |
| Insert Edge | O(1) | O(1) | O(1) | O(1) | N/A |
| Remove Node | O(E) | O(E) | O(E) | O(V^2) | N/A |
| Remove Edge | O(E) | O(E) | O(E) | O(1) | N/A |
| Check If v1 & v2 are Adjacent | O(E) | O(deg(V)) | O(deg(V)) | O(1) | O(1) |
| Iterate v1's Neighbors | O(E) | O(deg(V)) | O(deg(V)) | O(V) | O(1) |
| Check If Edge Exists | O(E) | O(E) | O(deg(V)) | O(1) | O(1) |
V = # of vertices (nodes), E = # of edges, deg(V) = degree of a vertex
R = # of rows in grid, C = # of columns in grid
Note that these complexities are average cases and can vary based on the specific implementation and the nature of the graph. Operations for the 2D grid are not applicable in the traditional sense because nodes and edges don't have the same meaning in a grid problem and it is more common to express complexities in terms of the number of Rows and Columns in the grid.


When to Use Graphs in Interviews
Graphs are used for representing relationships between data - so graph algorithms most frequently come up in those contexts. Oftentimes graphs are used in coding interviews to compute something that isn’t explicitly in a graph.
For example, you might see a problem that asks you to find the path between node A and node B. Or you might have to come up with the correct series of moves to solve some sort of game. Even though the problem might not directly frame itself as such, these are both graph problems. If you are playing chess, you have the current game state on the chess board. Visualizing the board as a graph (usually a 2D matrix) makes it easier to solve these problems.
Common examples of problems involving graphs include:
| Problem Type | Example | Notes |
|---|---|---|
| Board games / puzzle games | Sudoku, Chess, Go, Mazes, N-Queens, etc | Usually represented as a 2D matrix |
| Dependency problems (aka topological sort problems) | Course scheduling, task scheduling, todo scheduling, etc | Tends to be given in the form of an edge list or an adjacency list |
| Connectivity | Island count in a grid, Number of provinces | Can be represented in various ways. Depth-first search (DFS) or breadth-first search (BFS) are commonly used. |
| Shortest path problems | Minimum moves to get Knight from point A to B, shortest path from A to B, etc | Graph representation varies for these problems, but the optimal traversal choice tends to be a BFS. Advanced options include Dijkstra's algorithm or (rarely) Bellman-Ford. |
| Route based problems | Getting from point A to B (not necessarily the shortest path) | Graph representation varies for these problems, but these algorithms tend to be difficult to optimize and usually end up being a DFS + Backtracking combo |
| Cycle detection | Detecting a cycle in a linked list, Finding a cycle in a directed graph | Can be represented in various ways. Depth-first search (DFS) or breadth-first search (BFS) are commonly used. |
| Network flow | Maximum flow, Minimum Cut | Typically represented as an adjacency matrix. Often involve weighted edges. |
Common Mistakes in Interviews Featuring Graphs
Not Using (Or Misusing) a Visited Locations Data Structure
Hands down the most common mistake in graph questions is for a candidate to forget entirely or just misuse the visited locations data structure in a graph traversal. This data structure (usually represented as a 2D matrix or a hash table) keeps track of the nodes we have already visited in our graph traversal.
We use this data structure in both a BFS and DFS, yet it is incredibly common for candidates to entirely forget to track visited locations, forget to add newly visited locations to their visited data structure, and/or forget to check their visited locations before exploring a new location.
A final common mistake with this data structure is passing it around when making function calls. Candidates tend to accidentally create copies of a path that is not changing, leading to an ever-growing complexity in graph exploration. The key here is to use the same variable across all function calls unless the problem truly requires each path to have its own visited data structure.
Any of these rookie mistakes will result in an infinite loop and will likely lead to a rejection. This is so common that Googlers have internal memes about this mistake, so definitely don't make this mistake in your interview!
Coding Helper Functions Instead of the Main Algorithm
In most graph problems (especially board game/puzzle problems), you'll need helper methods to help you solve the problem. In the N-Queens problem, you'll need a helper function to check if a queen at a current row and column is under attack. In Sudoku you might need a helper function that determines if the current cell already has the chosen number in the row, column or surrounding area. These types of helper functions are considered "fluff" in the problem.
The mistake is that many people get bogged down in coding these helper functions first and wind up with a half working helper function and no main algorithm. At this point the interviewer is forced to give you a rejection because they don't know if you can code the algorithm or not because all the time was wasted on the meaningless helper function.
Focus on the algorithm and show you can code that. If you show that you can code the recursive backtracking DFS to solve the problem, then even if you don't have time to implement the helper functions you proposed the interviewer will know you're capable of it because you tackled the hardest part of the question first. Liberally define helper functions and leave them unimplemented until you're done solving the main parts of the algorithm.
Not Seeing the Problem as a Graph Problem
The infamous Alien Dictionary problem is a classic example of a problem where it is not intuitive at first glance that the problem is a graph problem. Be aware that sometimes it will take some critical thinking before realizing a problem can be thought of as a graph. For this particular problem, it takes lots of thought to construct rules that turn into dependencies in the form of an edge list and eventually give enough information to construct a graph.
Not Asking About the Characteristics of the Graph
- Can the graph have cycles?
- Is the graph directed or undirected?
- Is it possible that the graph is disconnected?
- Is the graph sparse or dense?
What to Say in Interviews to Show Mastery Over Graphs
Discuss Graph Representation
Sometimes we are given a graph in a "bad format" like an edge list and we will need to transform it into a different graph representation to solve the problem efficiently. In these circumstances, it's worthwhile to pause and discuss what graph representation you will choose. It's the sign of a senior engineer that discusses different ways to build the graph in these types of problems rather than just jumping into a single graph representation because that is what they are familiar with.
Discuss The Algorithm
The benefit to graph problems is that you wind up coding, one of two algorithms in 80% of all of the problems. These two graph algorithms are depth first search and breadth first search. Get comfortable with both! Before diving in and coding, discuss the trade-offs associated with each. In many problems either algorithm can work. Show mastery of the topic by briefly proposing both options and thoughtfully choosing one. When there is no obvious chose and either one seems appropriate, still give a justification for why you're coding the algorithm you've chosen, i.e. "It looks like either could work, but I'm going to go with a recursive DFS since it is easy to follow, easy to code, and easy to maintain."
Occasionally, in the remaining 20% of graph problems we might need a more niche algorithm to get the job done. The next most important algorithms to learn – in order – include:
- Topological sort (for those dependency problems!)
- Dijkstra's algorithm (when BFS isn't enough and we don't have negative edge weights)
- Union-Find (for the 1% of problems that can't use DFS instead)
Here at interviewing.io, we generally recommend avoiding spending time on more complicated algorithms including Bellman-Ford, A*, Prim's, etc. While some questions on leetcode do require an understanding of these algorithms, they are too niche for a general SWE to be expected to know off hand. Keep in mind you likely will need to know these algorithms if you are applying for a position that has graph theory requirements attached to it or if you have a background in graphs (like you have a graduate degree in graph theory, for instance).
About the Author

Michael Mroczka, a Google SWE, is one of the highest-rated mentors at interviewing.io and primarily works on the Dedicated Coaching program. He has a decade of coaching experience, having personally helped 100+ engineers get into Google and other desirable tech companies. After receiving multiple offers from tech companies early in his career, he enjoys teaching others proven techniques to pass technical interviews.
He also sometimes writes technical content for interviewing.io (like this piece) and was one of the authors of interviewing.io’s A Senior Engineer's Guide to the System Design Interview.

About interviewing.io
interviewing.io is a mock interview practice platform. We've hosted over 100K mock interviews, conducted by senior engineers from FAANG & other top companies. We've drawn on data from these interviews to bring you the best interview prep resource on the web.

